Documentation
Everything you need to deploy and manage your Odoo applications with CloudWady
Platform Overview
CloudWady is a professional deployment platform that automates the provisioning, deployment, and management of Odoo applications. It integrates cloud providers, Git repositories, Ansible automation, and real-time monitoring into a unified dashboard.
Key Capabilities
- Multi-Environment Projects: Organize deployments into Production, Staging, and Development environments.
- Automated Deployments: One-click deploy, update, backup, and restore using Ansible playbooks executed by InfraRelay workers.
- Git Integration: Connect GitHub repositories via GitHub App for automatic branch tracking and webhook-triggered deployments.
- Cloud Provisioning: Auto-provision servers on Hetzner, DigitalOcean, with Cloudflare DNS and SSL management.
- Real-Time Monitoring: Embedded Grafana dashboards for CPU, memory, disk, network metrics, and application logs.
- Alerting System: Proactive backup, SSL, server cleanup, and core addons update alerts with integration channels (Email, PagerDuty, OpsGenie, webhooks).
- Role-Based Access: Granular per-company permissions from Viewer to Admin with environment-specific controls.
Quick Start Guide
Get your first Odoo application deployed in minutes:
- Log in to the Dashboard - Access your CloudWady dashboard. You will land on the main Overview screen.
- Create a Project - Navigate to a project and use "New Deployment App" in the environment toolbar, or use the project creation wizard to set up a complete project with server and environment.
- Review Your Project - Once created, the project dashboard shows your environments (Production, Staging, Development) with server metrics and app cards.
- Configure Your App - Open the app to set the Odoo version, edition, Git branch, and environment variables.
- Deploy - Click the Deploy button. CloudWady builds and deploys your application using Ansible automation.
- Monitor - Watch deployment progress in real-time via workflow logs. Once complete, click "Open" to access your running Odoo instance.
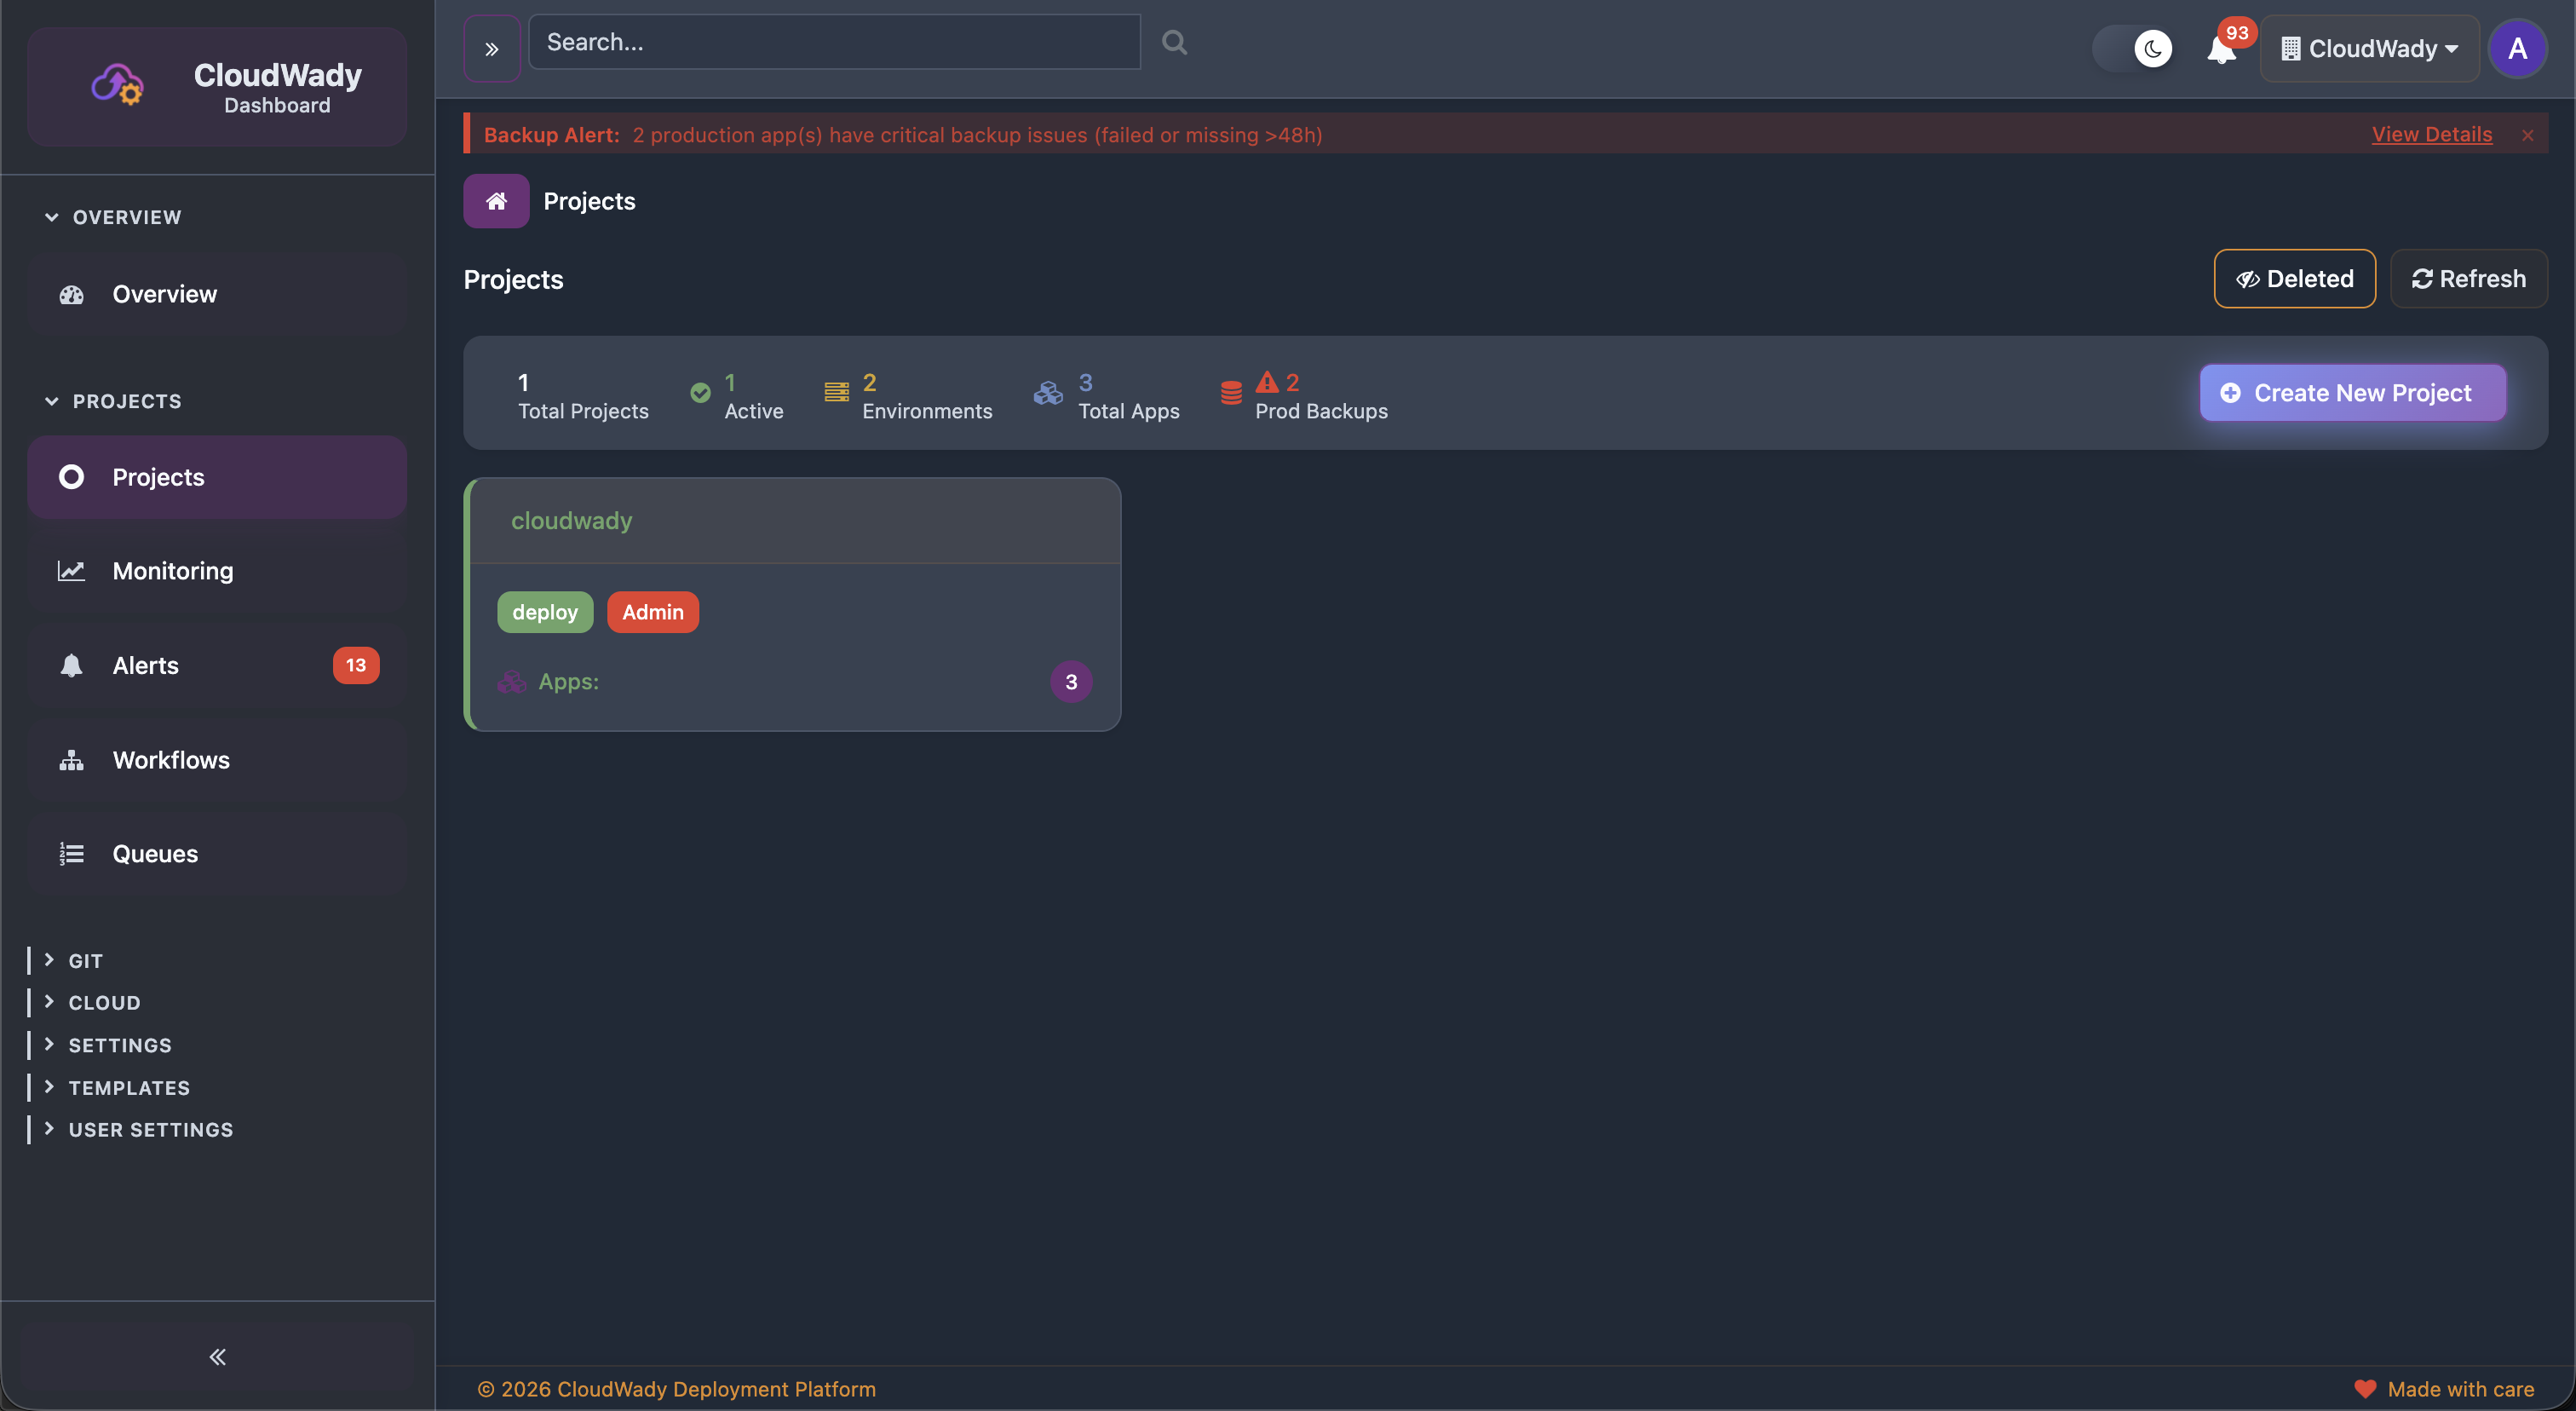
Understanding the Dashboard
The main dashboard is your command center, providing a high-level overview of your entire platform.
Dashboard Sidebar
The left sidebar organizes the platform into collapsible sections. Sections like Git, Cloud, Settings, and Templates are collapsed by default and require appropriate permissions.
| Section | Menu Item | Icon | Access Level |
|---|---|---|---|
| Overview | Overview | fa-tachometer | All |
| Projects | Projects | oi-odoo | All |
| Projects | Monitoring | fa-line-chart | All |
| Projects | Alerts (with issue count badge) | fa-bell | All |
| Projects | Workflows | fa-sitemap | All |
| Projects | Queues | fa-list-ol | All |
| Git | |||
| └ | Registries | fa-id-card | Maintainer |
| └ | Project Registries | fa-github | Maintainer |
| Cloud | |||
| └ | Servers | fa-server | Maintainer |
| └ | Storage | fa-hdd-o | Maintainer |
| └ | Cloud Providers | fa-cloud | Maintainer |
| └ | Domain Providers | fa-globe | Maintainer |
| Settings | |||
| └ | Users | fa-users | Admin |
| └ | Pricing Overview | fa-credit-card | Maintainer |
| └ | Namespace | fa-cogs | Maintainer |
| Templates | |||
| └ | Playbooks | fa-play-circle | Maintainer |
| └ | Templates | fa-file-code-o | Maintainer |
| └ | Template Overrides | fa-copy | Maintainer |
| └ | Playbook Overrides | fa-files-o | Maintainer |
| User Settings | My Settings | fa-bell | All |
Stats Cards
Summary cards at the top show: Total Projects, Active count, Environments, Total Apps, and Production Backups status.
GitHub App Integration
If a GitHub App is connected, an announcement card displays the app name, organization, connected repositories count, and last sync date.
Available Actions
| Action | Description | Access Level |
|---|---|---|
| GitHub App: Update | Sync GitHub App data and repositories | Maintainer |
| GitHub App: Fetch | Fetch latest repository info from GitHub | Maintainer |
Creating a Project
Projects are the primary organizational unit. The creation wizard walks you through setting up everything from naming to build configuration.
Step 1: Project Information
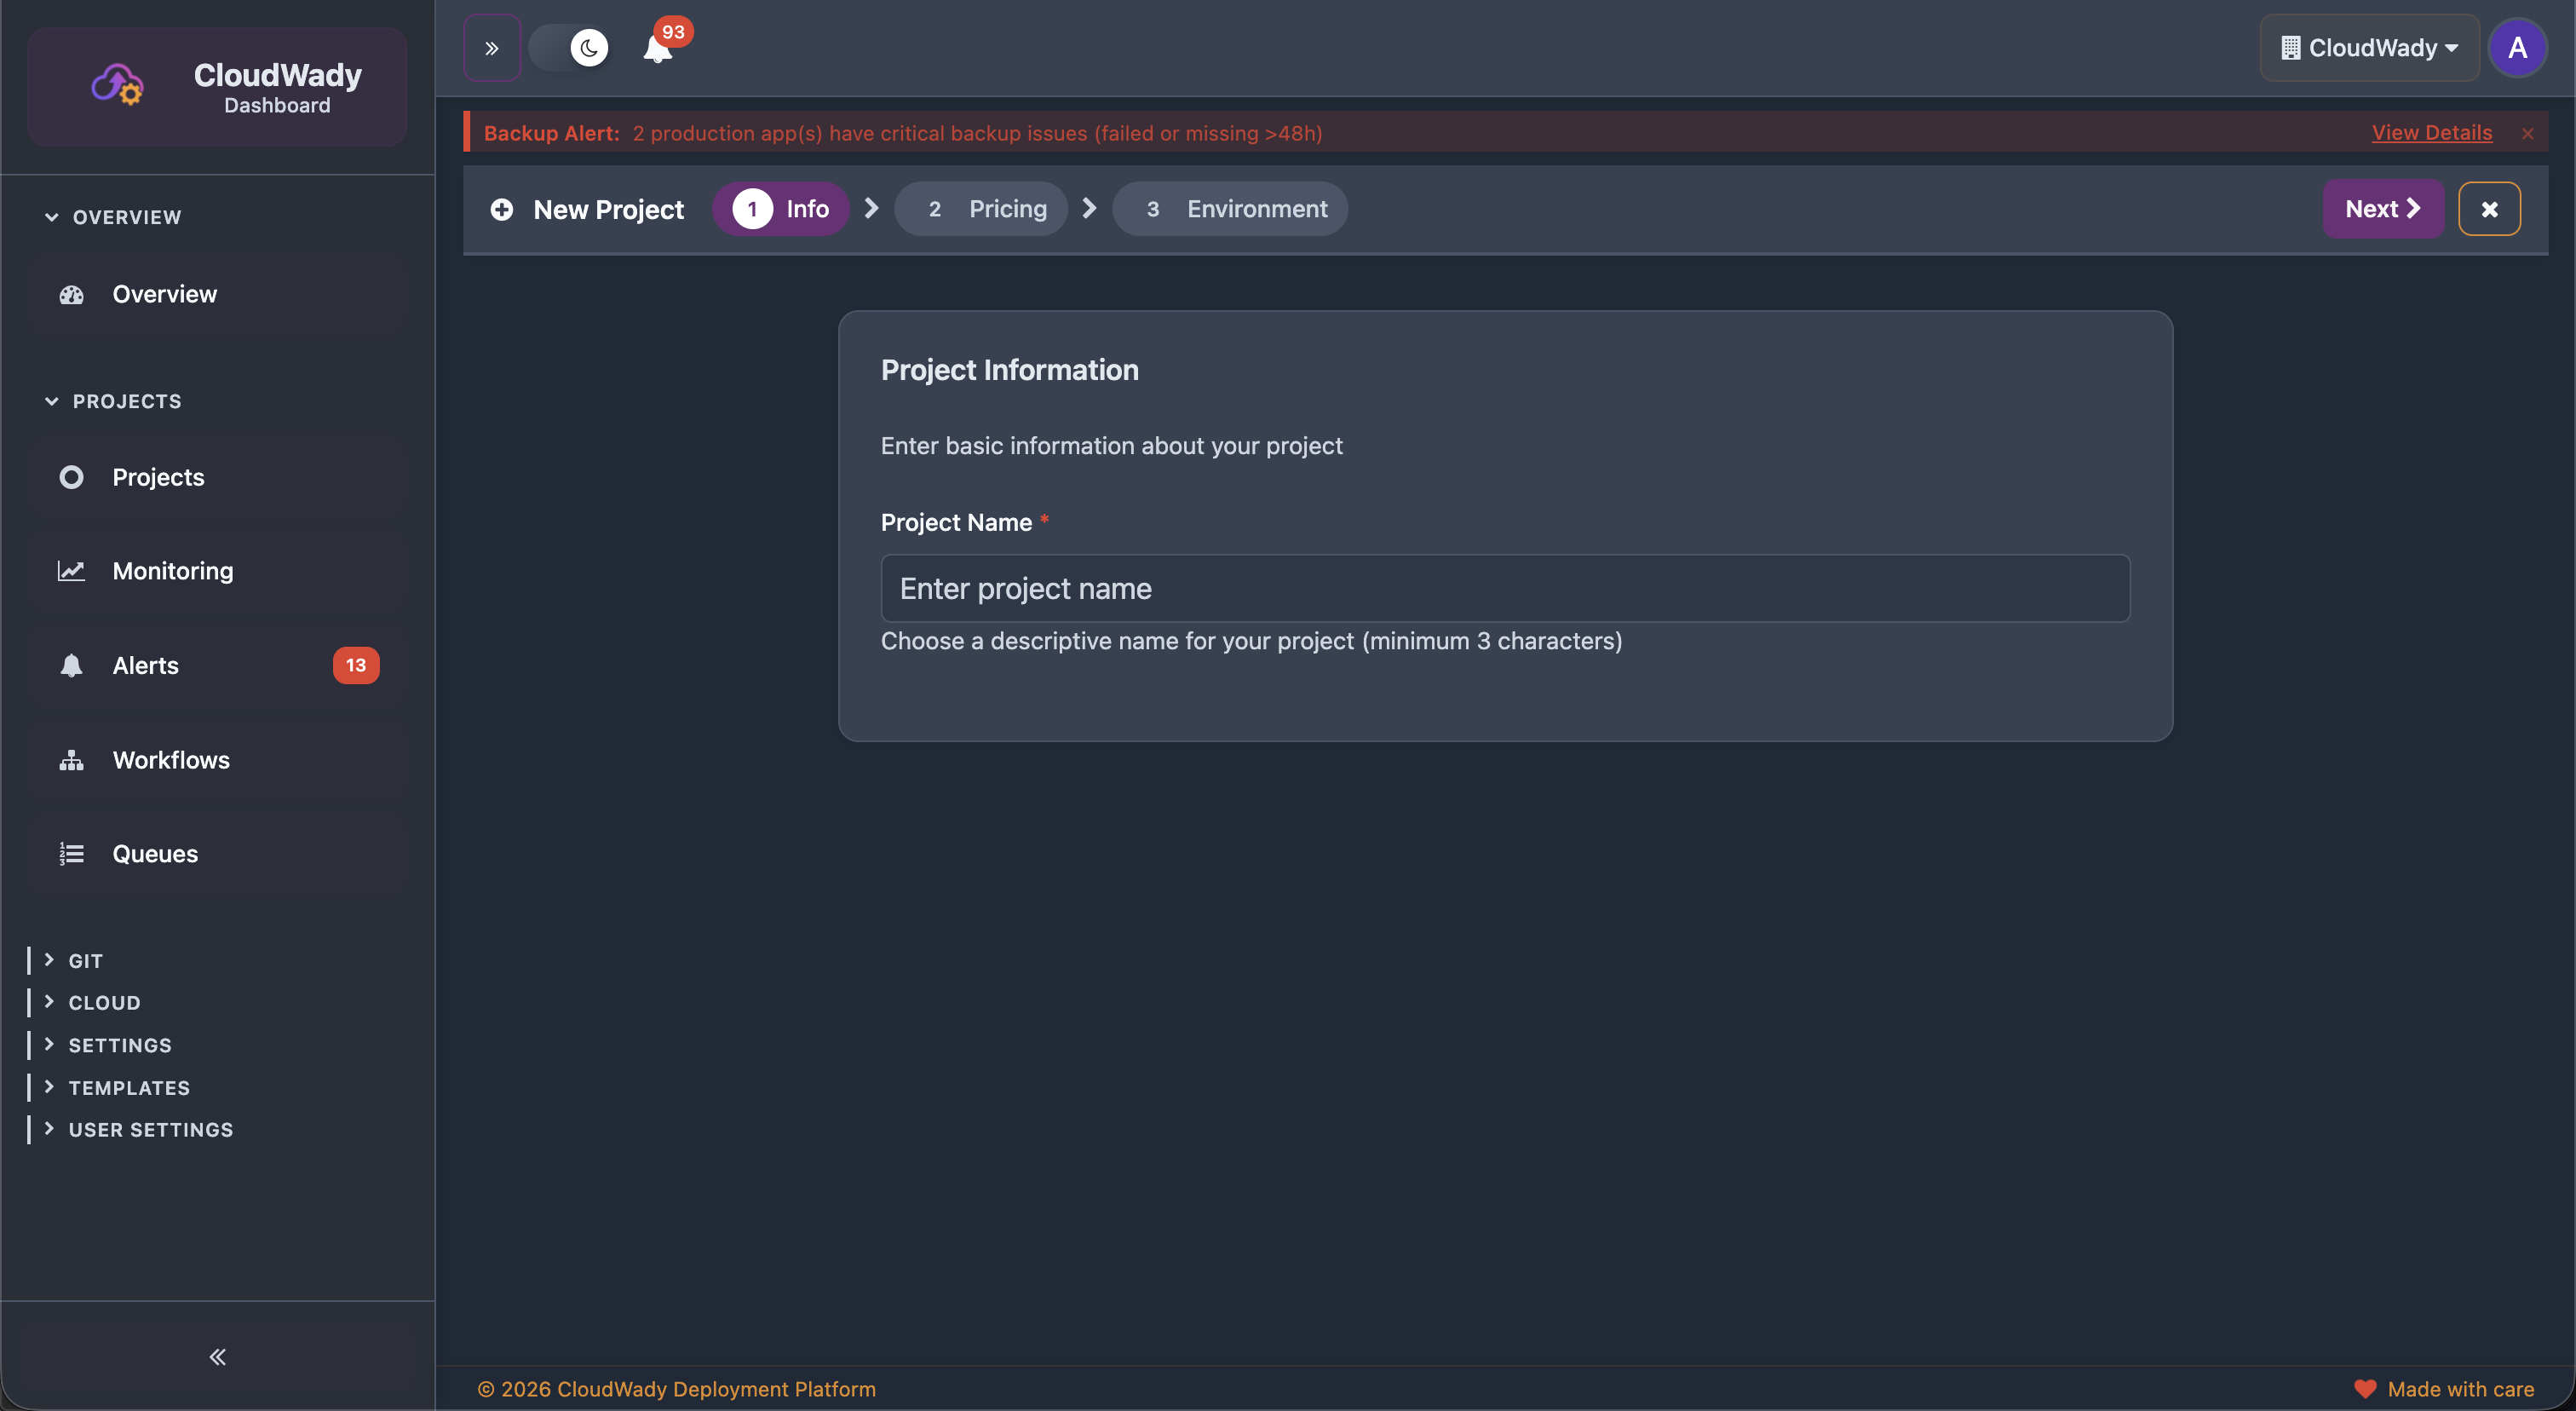
Configure project details:
- Prefix: Project name prefix used for resource naming.
- Project Registry: Select the Git repository to connect. Use the refresh button to sync registry data.
- Domain Provider: Select the DNS provider (e.g., Cloudflare).
- Environment Type: Choose Development, Staging, or Production as the initial environment.
Step 2: Pricing Plan
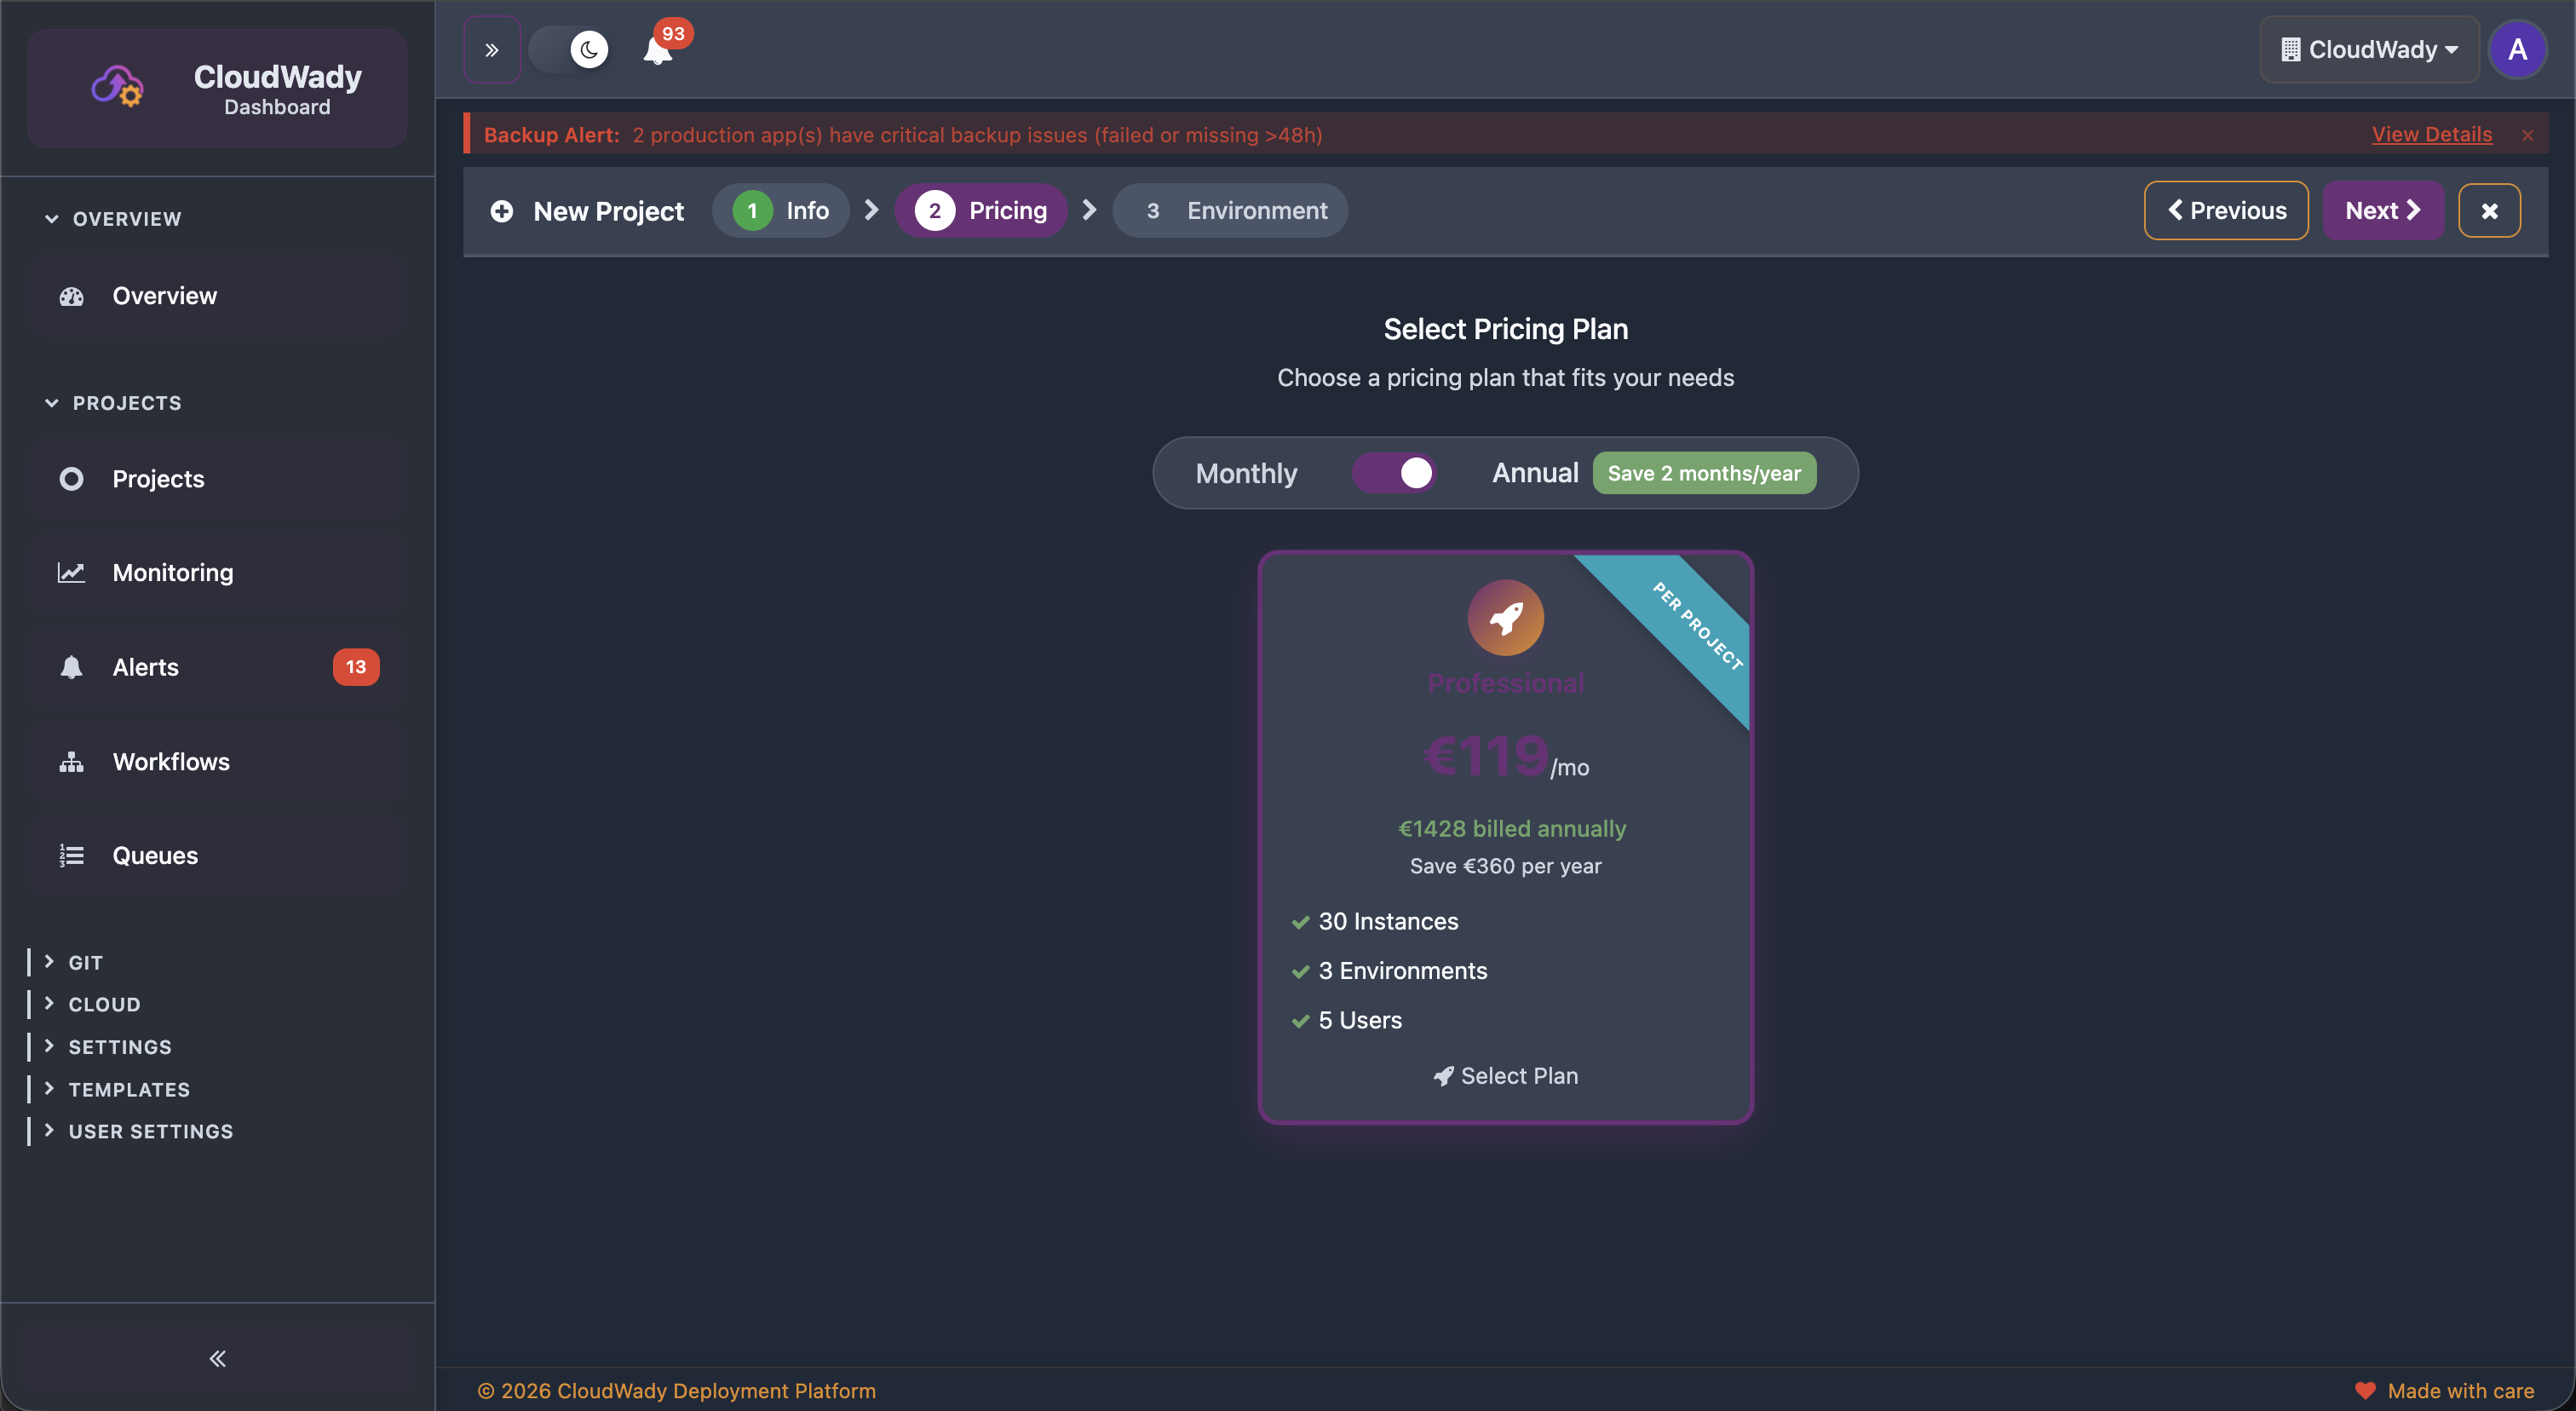
Choose a pricing plan that fits your needs. Toggle between Monthly and Annual billing - annual plans save approximately 2 months per year. Each plan defines the number of instances, environments, and users available.
Step 3: Environment Configuration
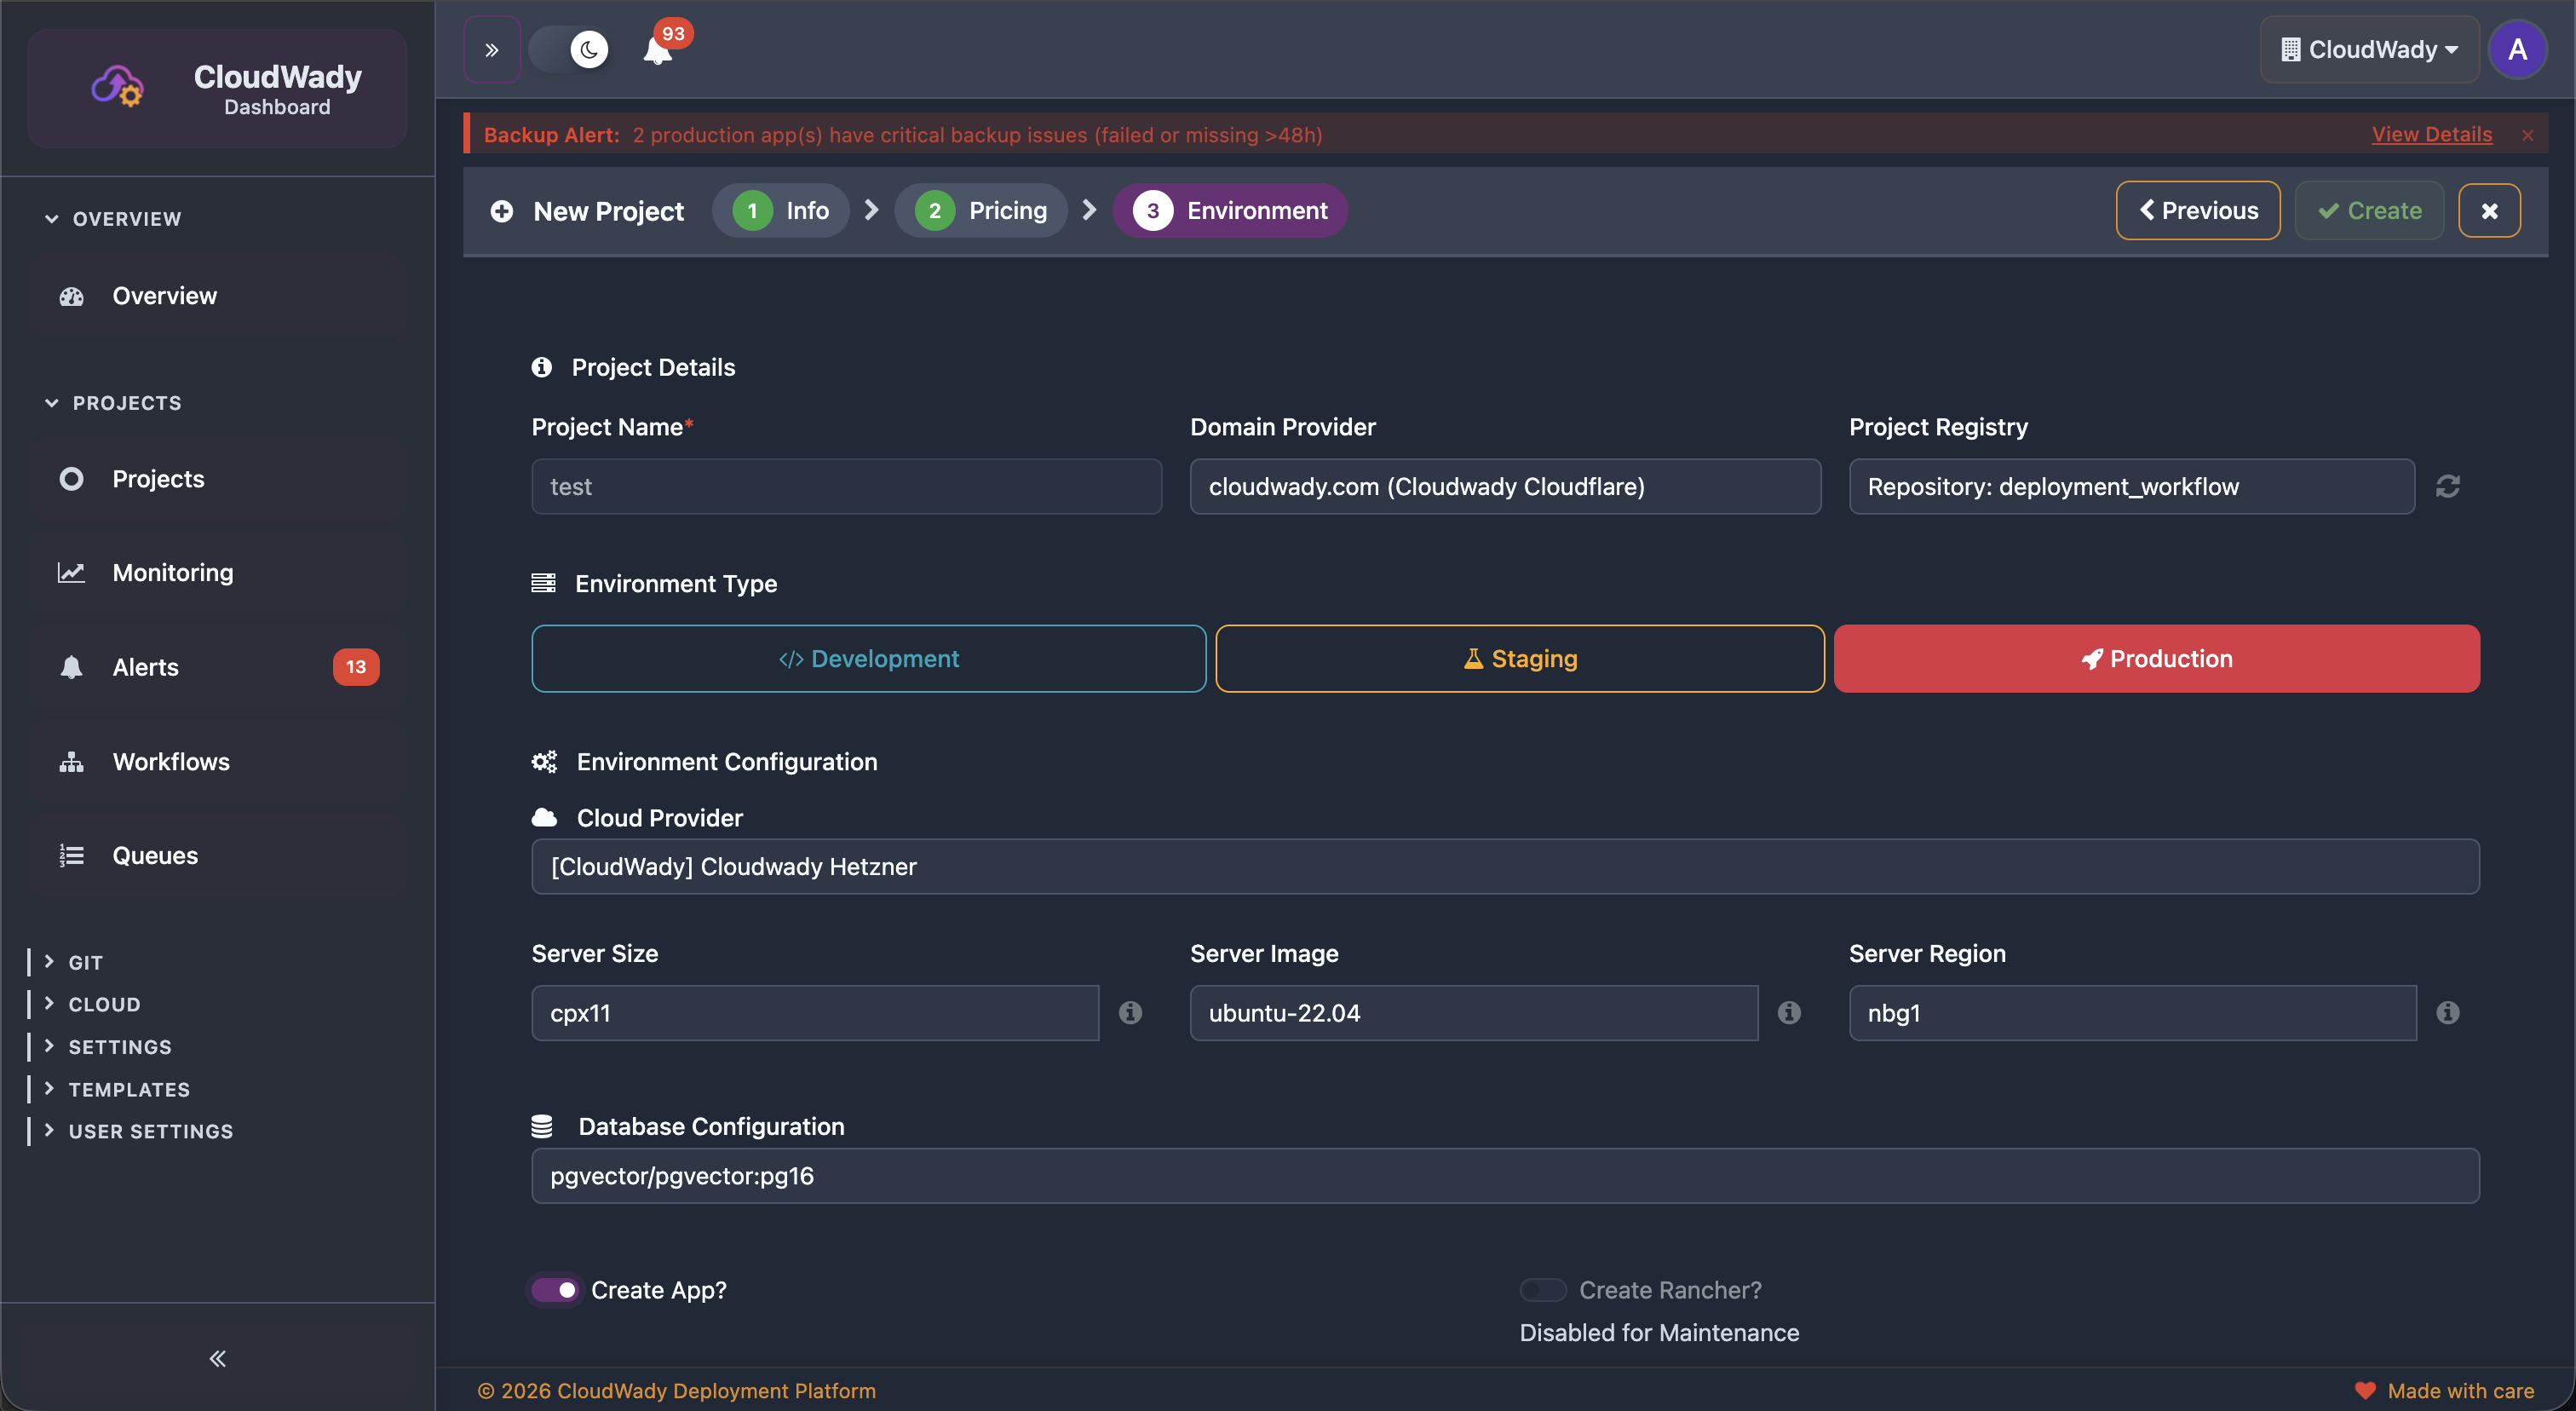
Configure the deployment infrastructure:
- Cloud Provider: Select where to provision the server (e.g., Hetzner).
- Server Size: Choose the server spec (e.g., cpx11, cpx21, cpx31).
- Server Image: Select the OS image (e.g., ubuntu-22.04).
- Server Region: Choose the datacenter location.
- Database: Select the PostgreSQL server for your apps.
- Create App: Optionally create an initial application during setup.
Step 4: Build Configuration
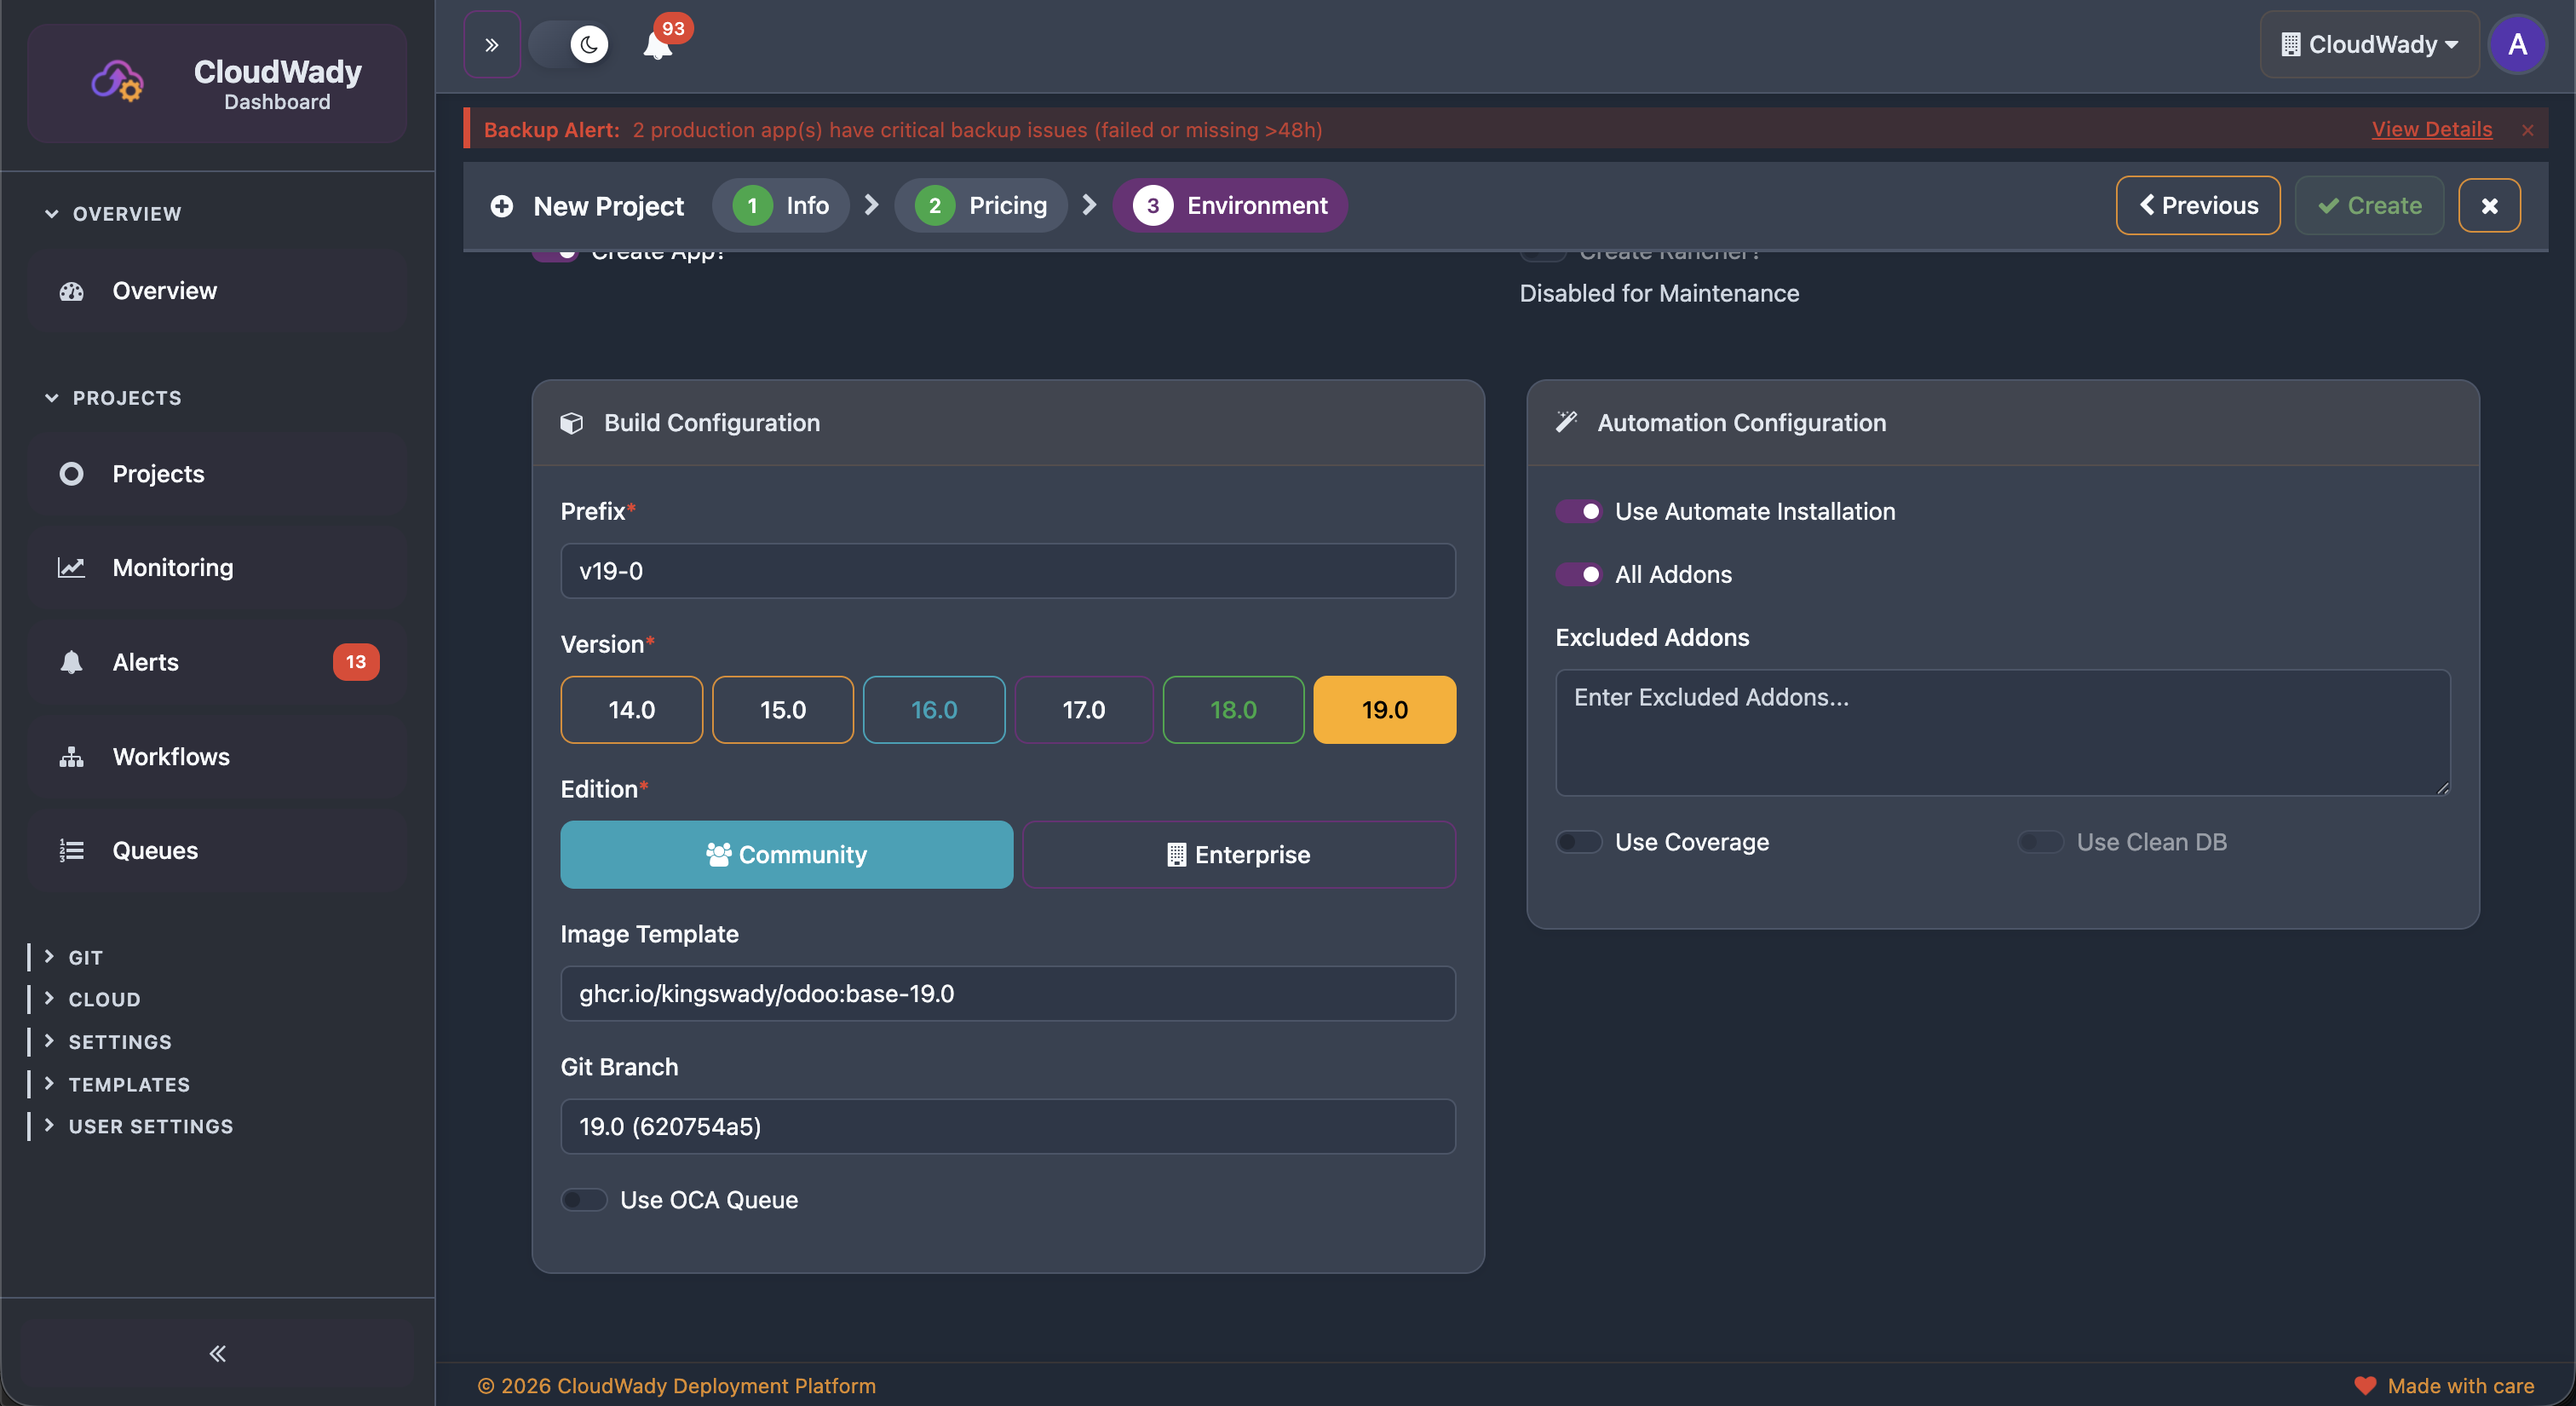
Set up the build and automation options:
- Prefix: Name prefix for the application (e.g., v19.0).
- Version: Odoo version from 14.0 to 19.0.
- Edition: Community or Enterprise.
- Image Template: Base Docker image for the build.
- Git Branch: The branch to deploy with its commit SHA.
- Use OCA Queue: Enable OCA queue job support.
- Automatic Installation: Auto-install modules on deployment.
- Excluded Addons: Specify addons to skip during installation.
- Coverage/Clean Diff: Code quality analysis options.
Project Dashboard
The project dashboard provides a comprehensive view of your environments, servers, and applications within a project.
Project Sidebar
Inside a project, the sidebar provides navigation to all project sub-screens:
| Menu Item | Icon | Description |
|---|---|---|
| Dashboard | fa-tachometer | Environment overview with app cards. Sub-tabs for environment (Production/Staging/Development) and version (14.0-19.0) |
| Users | fa-users | Team and access management |
| Queue | fa-tasks | Background job processing for this project |
| Workflow | fa-sitemap | Ansible workflow execution history |
| Databases | fa-database | Database server management |
| Storages | fa-hdd-o | Storage box assignments for backups |
| Project Info | fa-info-circle | Project name, code, type, and configuration (General Info / Configuration tabs) |
| Pricing & Plans | fa-credit-card | Project billing and plan management |
Project Overview Tabs
The Project Info screen contains two overview tabs:
| Tab | Badge | Description |
|---|---|---|
| General Info | Core | Project name, code, type, registry, domain provider |
| Configuration | Advanced | Project-level build and deployment configuration |
Screenshot: Project General Info tab
Screenshot: Project Configuration tab
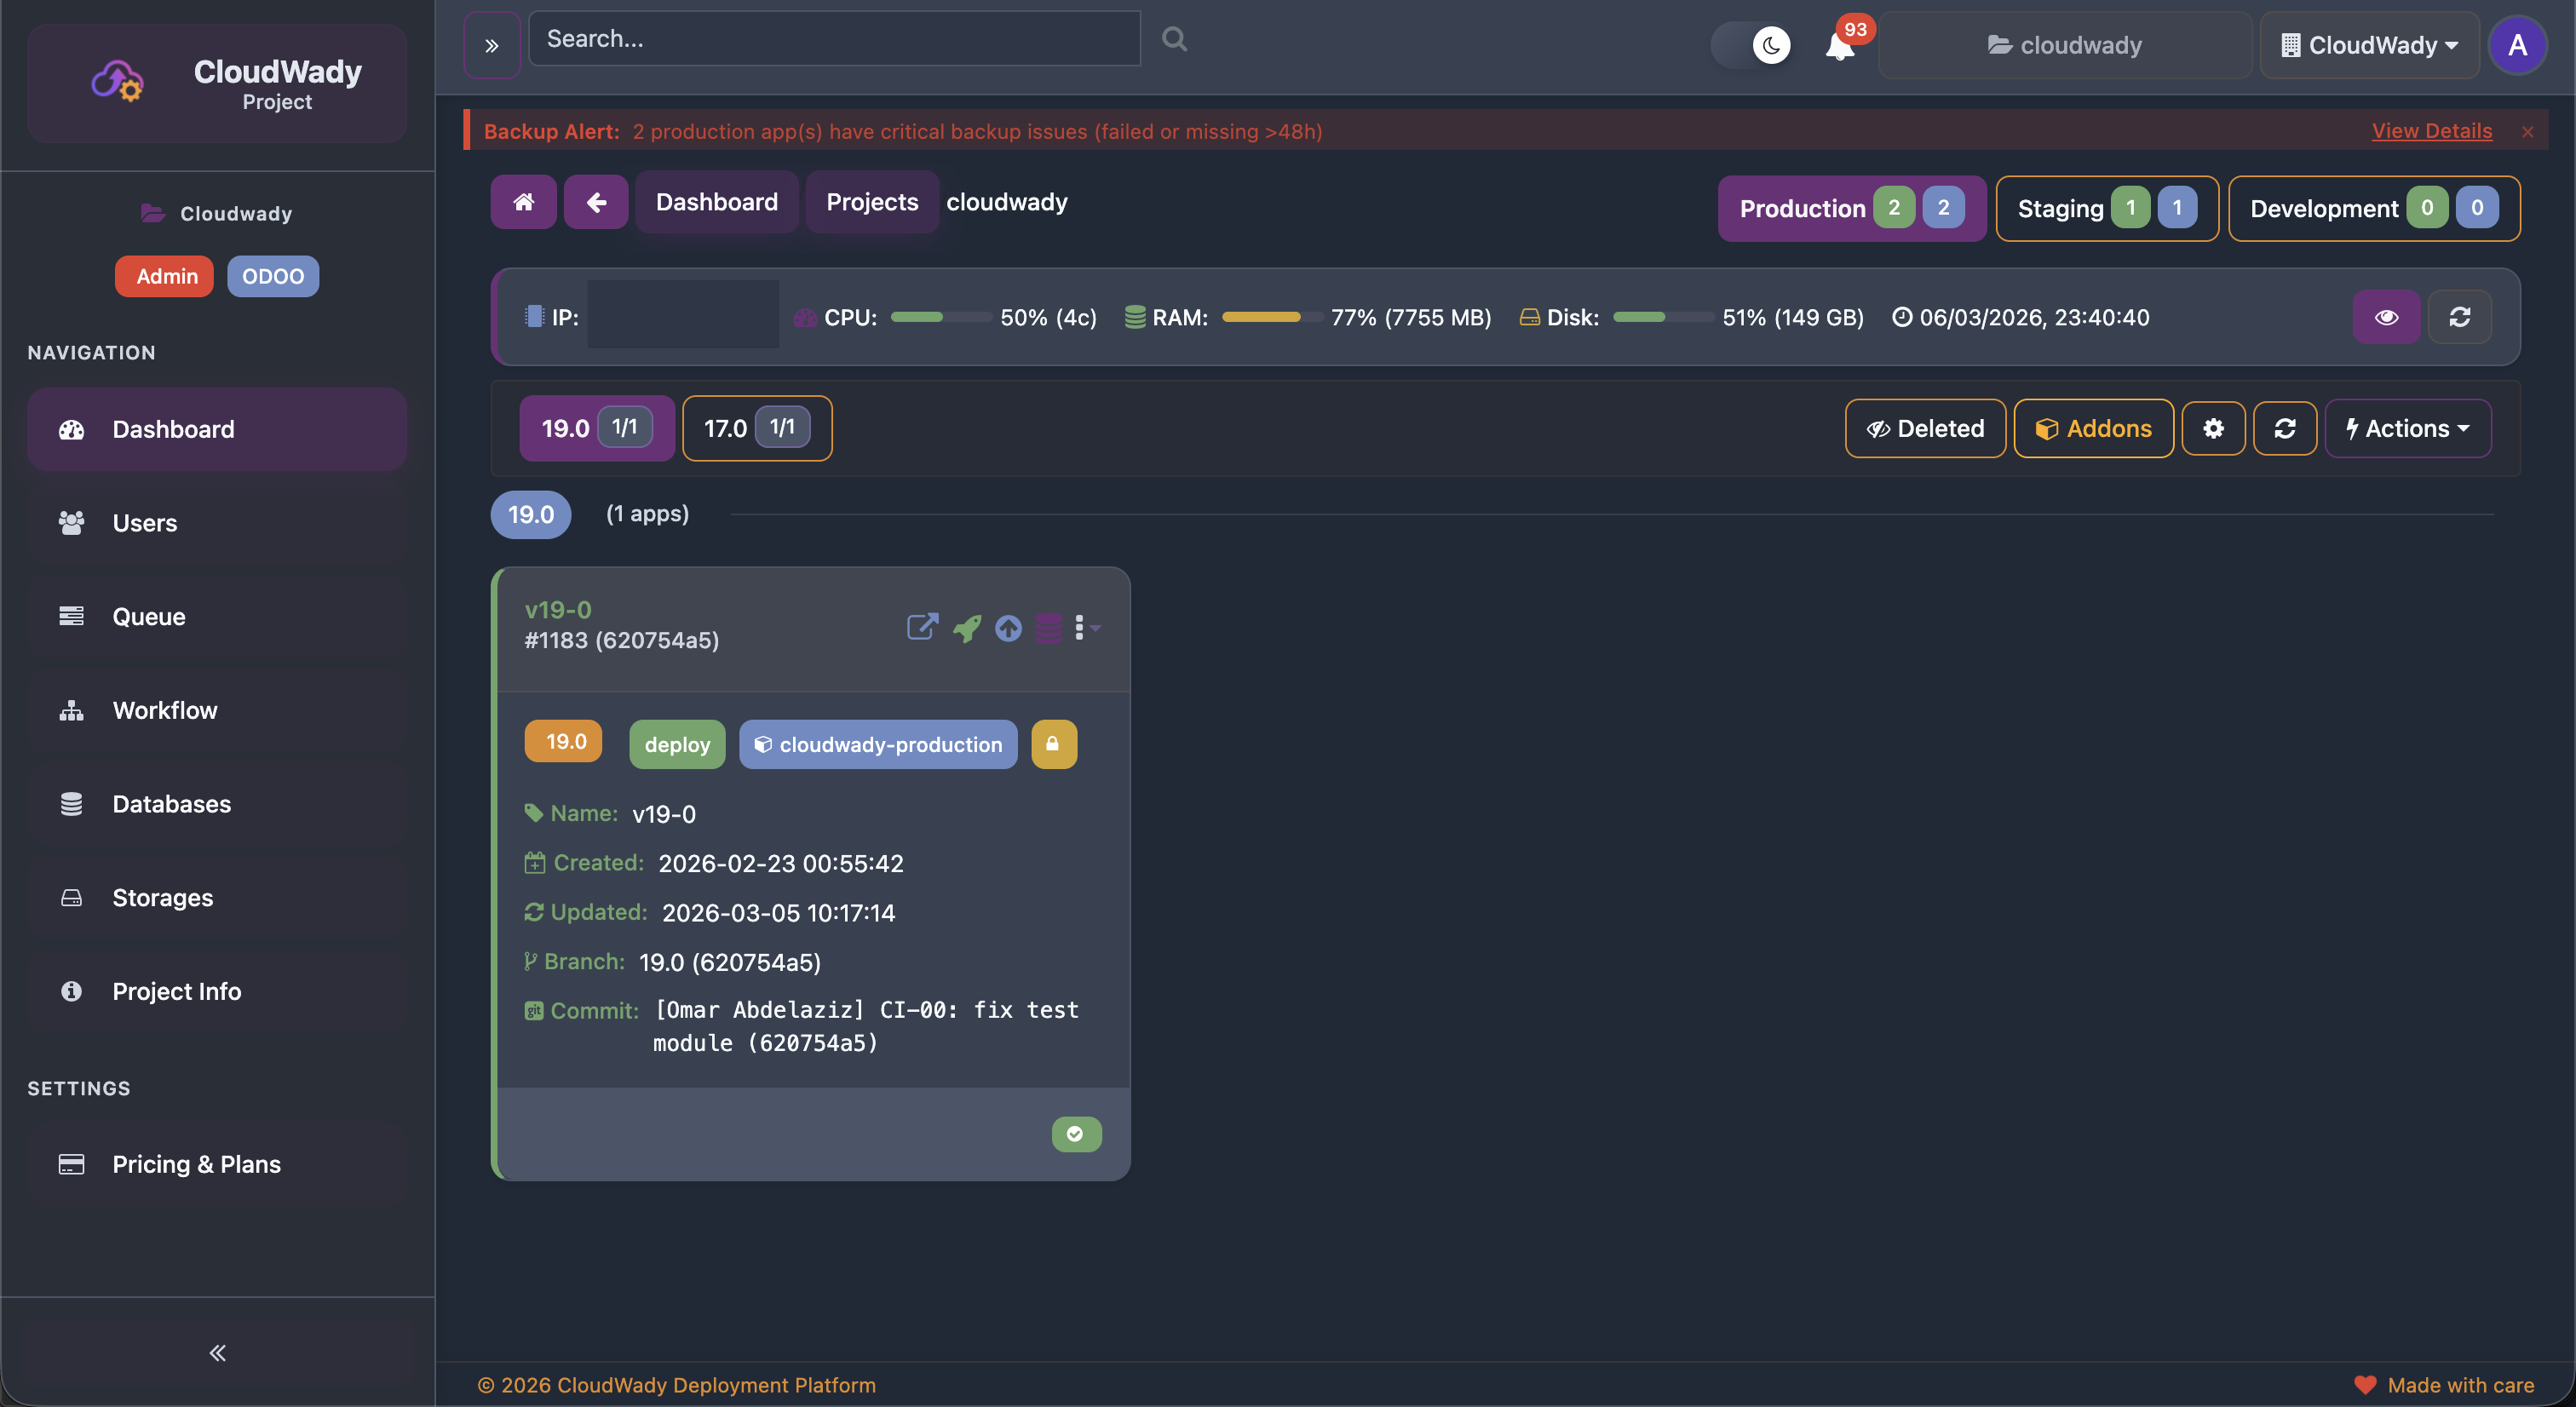
Environment Tabs
Colored tabs at the top show your environments with app counts:
- Production ( red) - Live applications serving end users.
- Staging ( yellow) - Pre-production testing environment.
- Development ( green) - Active development and feature testing.
Each tab shows two badge numbers: deployed apps and total apps in that environment.
Server Metrics
The server card displays real-time resource usage: IP address, CPU percentage and core count, RAM usage with progress bar, disk usage with total capacity, and last metrics collection time.
Version Tabs & App Cards
Version tabs (19.0, 18.0, 17.0, etc.) filter applications by Odoo version, showing active/archived counts per version. Each app card shows the name, ID, commit SHA, version badge, environment tags, timestamps, branch info, and status indicators (green check for healthy, warning triangles for issues).
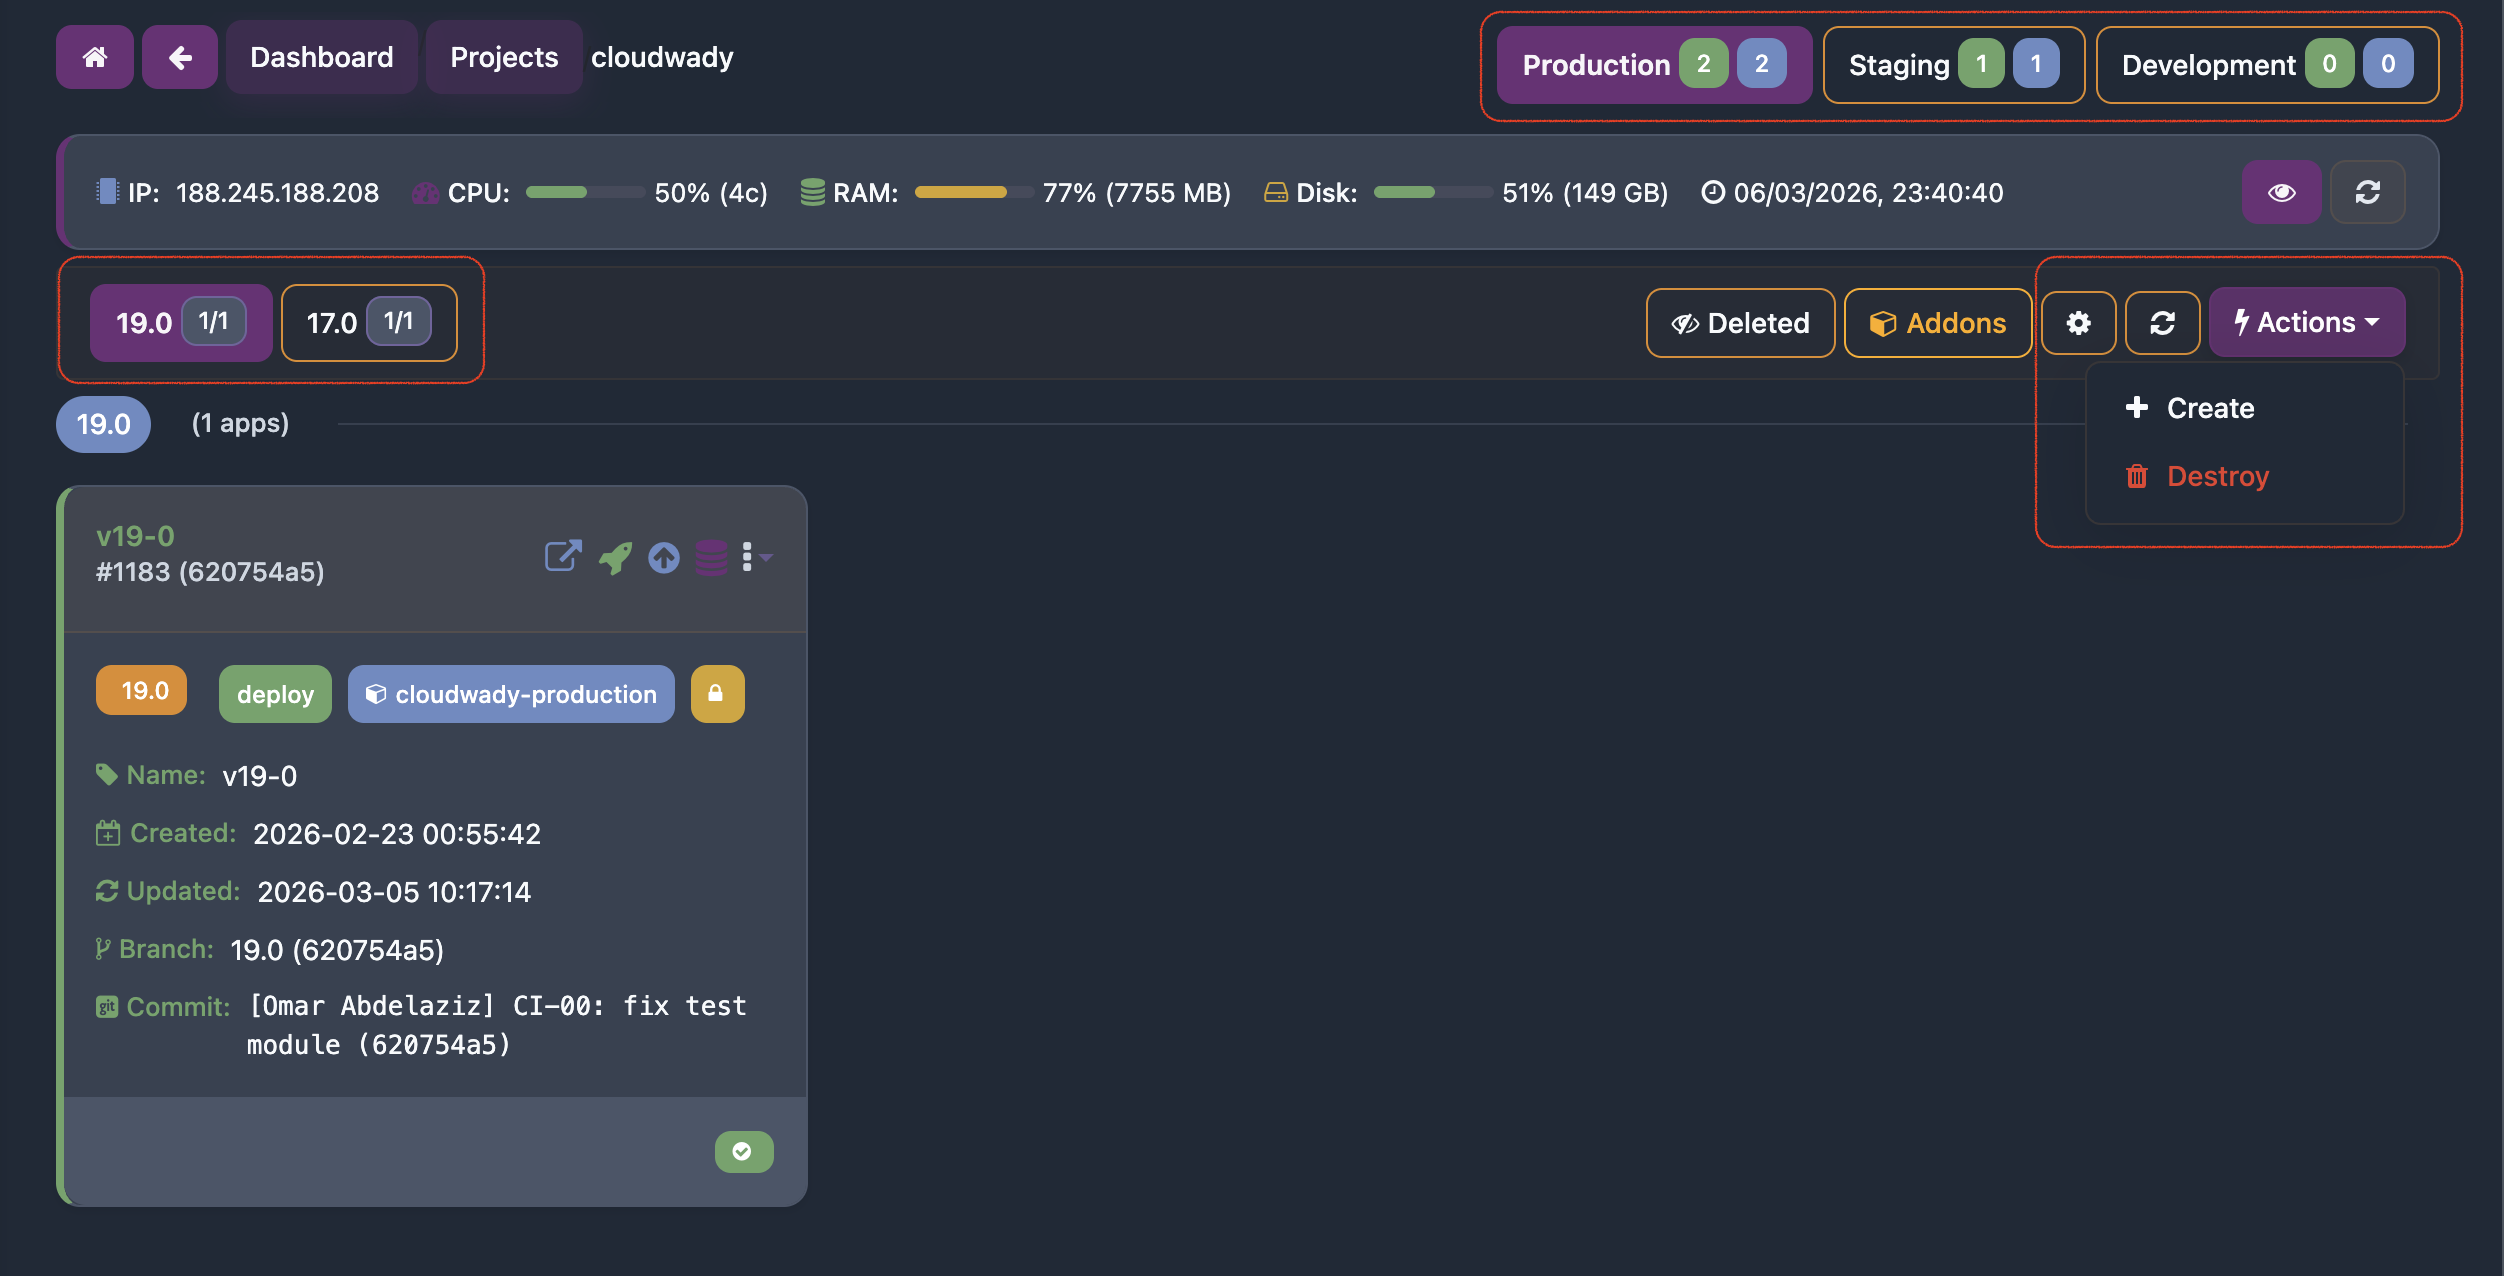
Environment Toolbar Actions
| Action | Description | Access Level |
|---|---|---|
| New Deployment App | Create a new application in this environment | Developer+ (env-type specific) |
| Automate Environment | Auto-configure environment automation settings | Developer+ (env-type specific) |
| Destroy | Destroy selected applications (danger zone) | Admin |
| Refresh | Reload environment data | All |
| Show Disabled Apps | Toggle visibility of disabled/archived apps | All |
App Card Actions
Each app card provides quick action buttons and a dropdown menu:
| Action | Description | Access Level |
|---|---|---|
| Open | Launch app URL in new browser tab | All |
| Deploy | Full deployment: build, configure, start | Developer+ (env-type specific) |
| Update | Pull latest code and restart | Developer+ (env-type specific) |
| Backup | Create database + filestore backup | Developer+ (env-type specific) |
| Retry | Retry failed deployment (only when state is error/canceled) | Developer+ (env-type specific) |
| More (⋮) | Dropdown with all additional actions and settings | Varies |
| Log Stats badges | Click warning/error count badges to navigate to logs | Viewer+ |
Environments
Environments provide logical separation for different stages of your deployment lifecycle.
| Environment | Purpose | Min. Access to Deploy |
|---|---|---|
| Production | Live applications serving end users | Developer Plus |
| Staging | Pre-production testing and validation | Developer |
| Development | Active development and feature testing | Developer |
Environment Features
- Each environment is assigned to a specific server with visible resource metrics.
- Applications are grouped by Odoo version (e.g., 19.0, 18.0, 17.0).
- Environment-level addons management for shared addons across all apps.
- Cross-server restoration support for migrating apps between environments.
- Per-environment automation settings for bulk configuration.
Available Actions
| Action | Description | Access Level |
|---|---|---|
| New Deployment App | Open the app creation dialog for this environment | Developer+ (env-type specific) |
| Automate Environment | Configure automation settings (auto-install, coverage, clean DB) | Developer+ (env-type specific) |
| Destroy | Destroy environment resources (danger zone) | Admin |
| Refresh | Reload environment data | All |
| Show Disabled Apps | Toggle visibility of disabled apps | All |
| Addons (settings view) | Manage shared addons across all apps in this environment | Developer+ |
| Save / Reset | Save or discard changes to environment automation settings | Developer+ |
Environment Automation Fields
When editing automation settings, the following fields are available: update type, automatic installation toggle, coverage analysis toggle, clean database toggle, and acceptable coverage threshold.
User Management
CloudWady provides comprehensive user management for both platform-wide and project-level access control.
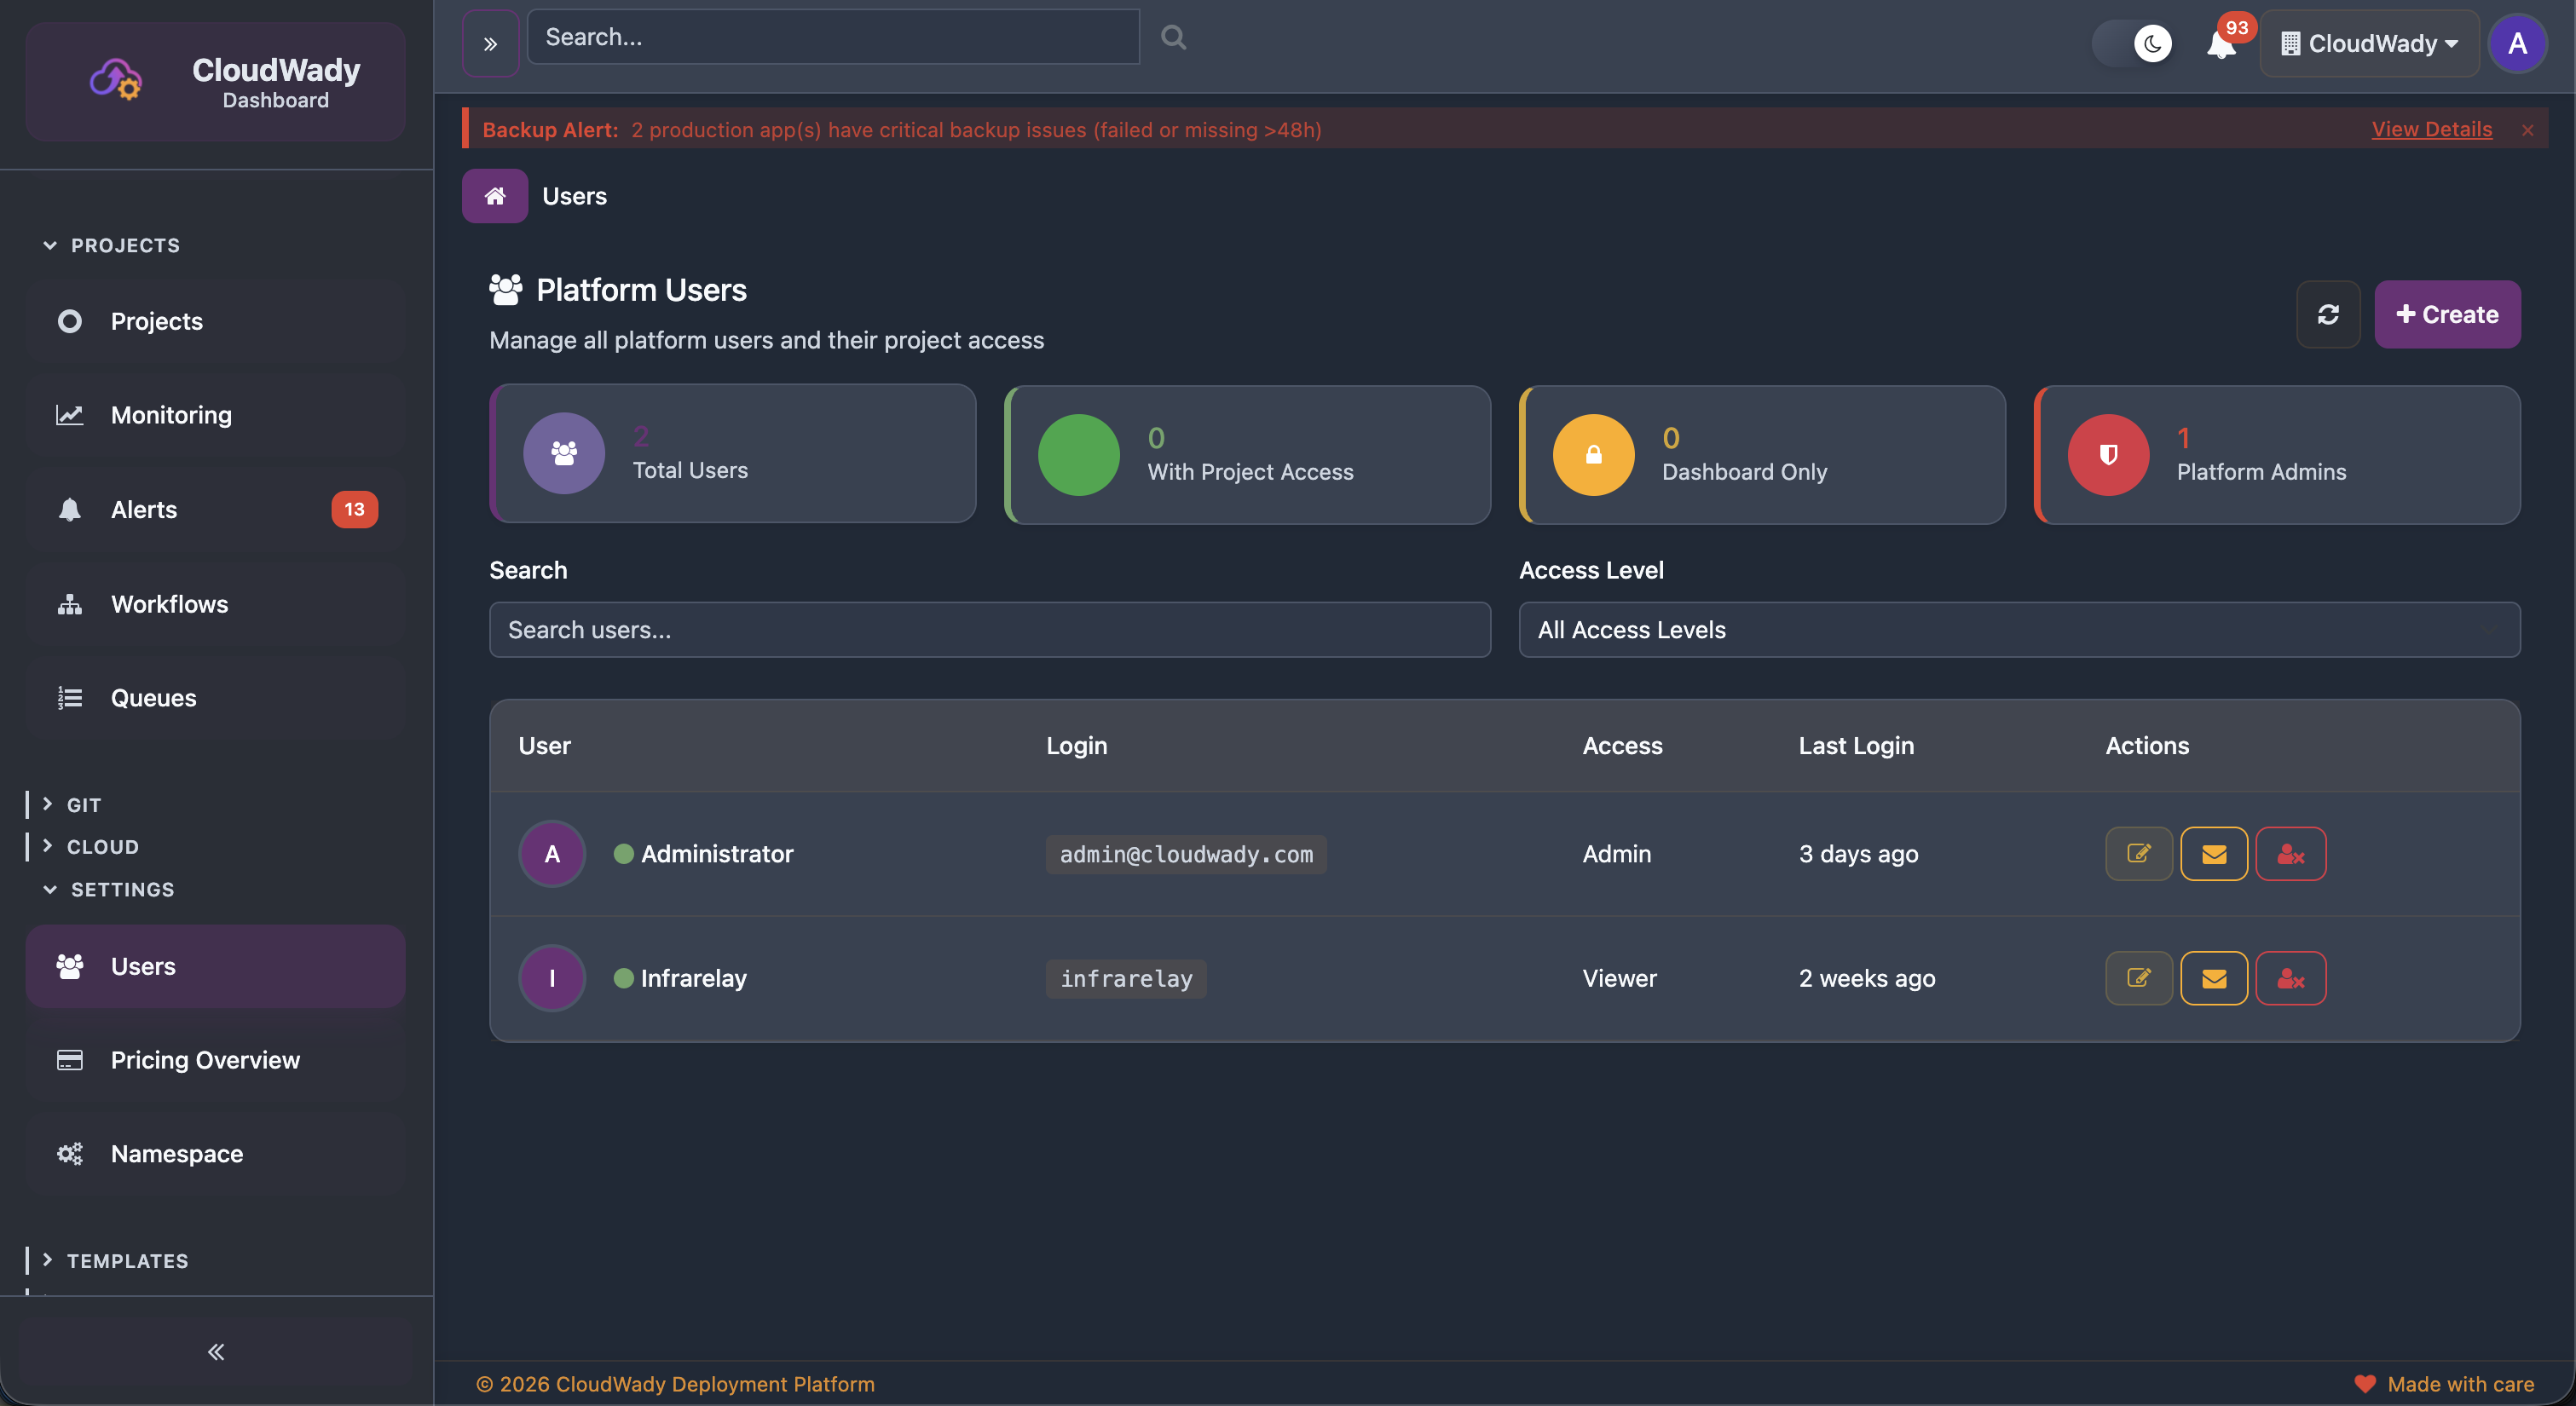
User Overview
The Users screen shows statistics cards for: Total Users, Users with Project Access, Dashboard Only users, and Platform Admins. The user table displays login, access level, active status indicator, last login time, and inherited access info for each user.
Editing User Roles
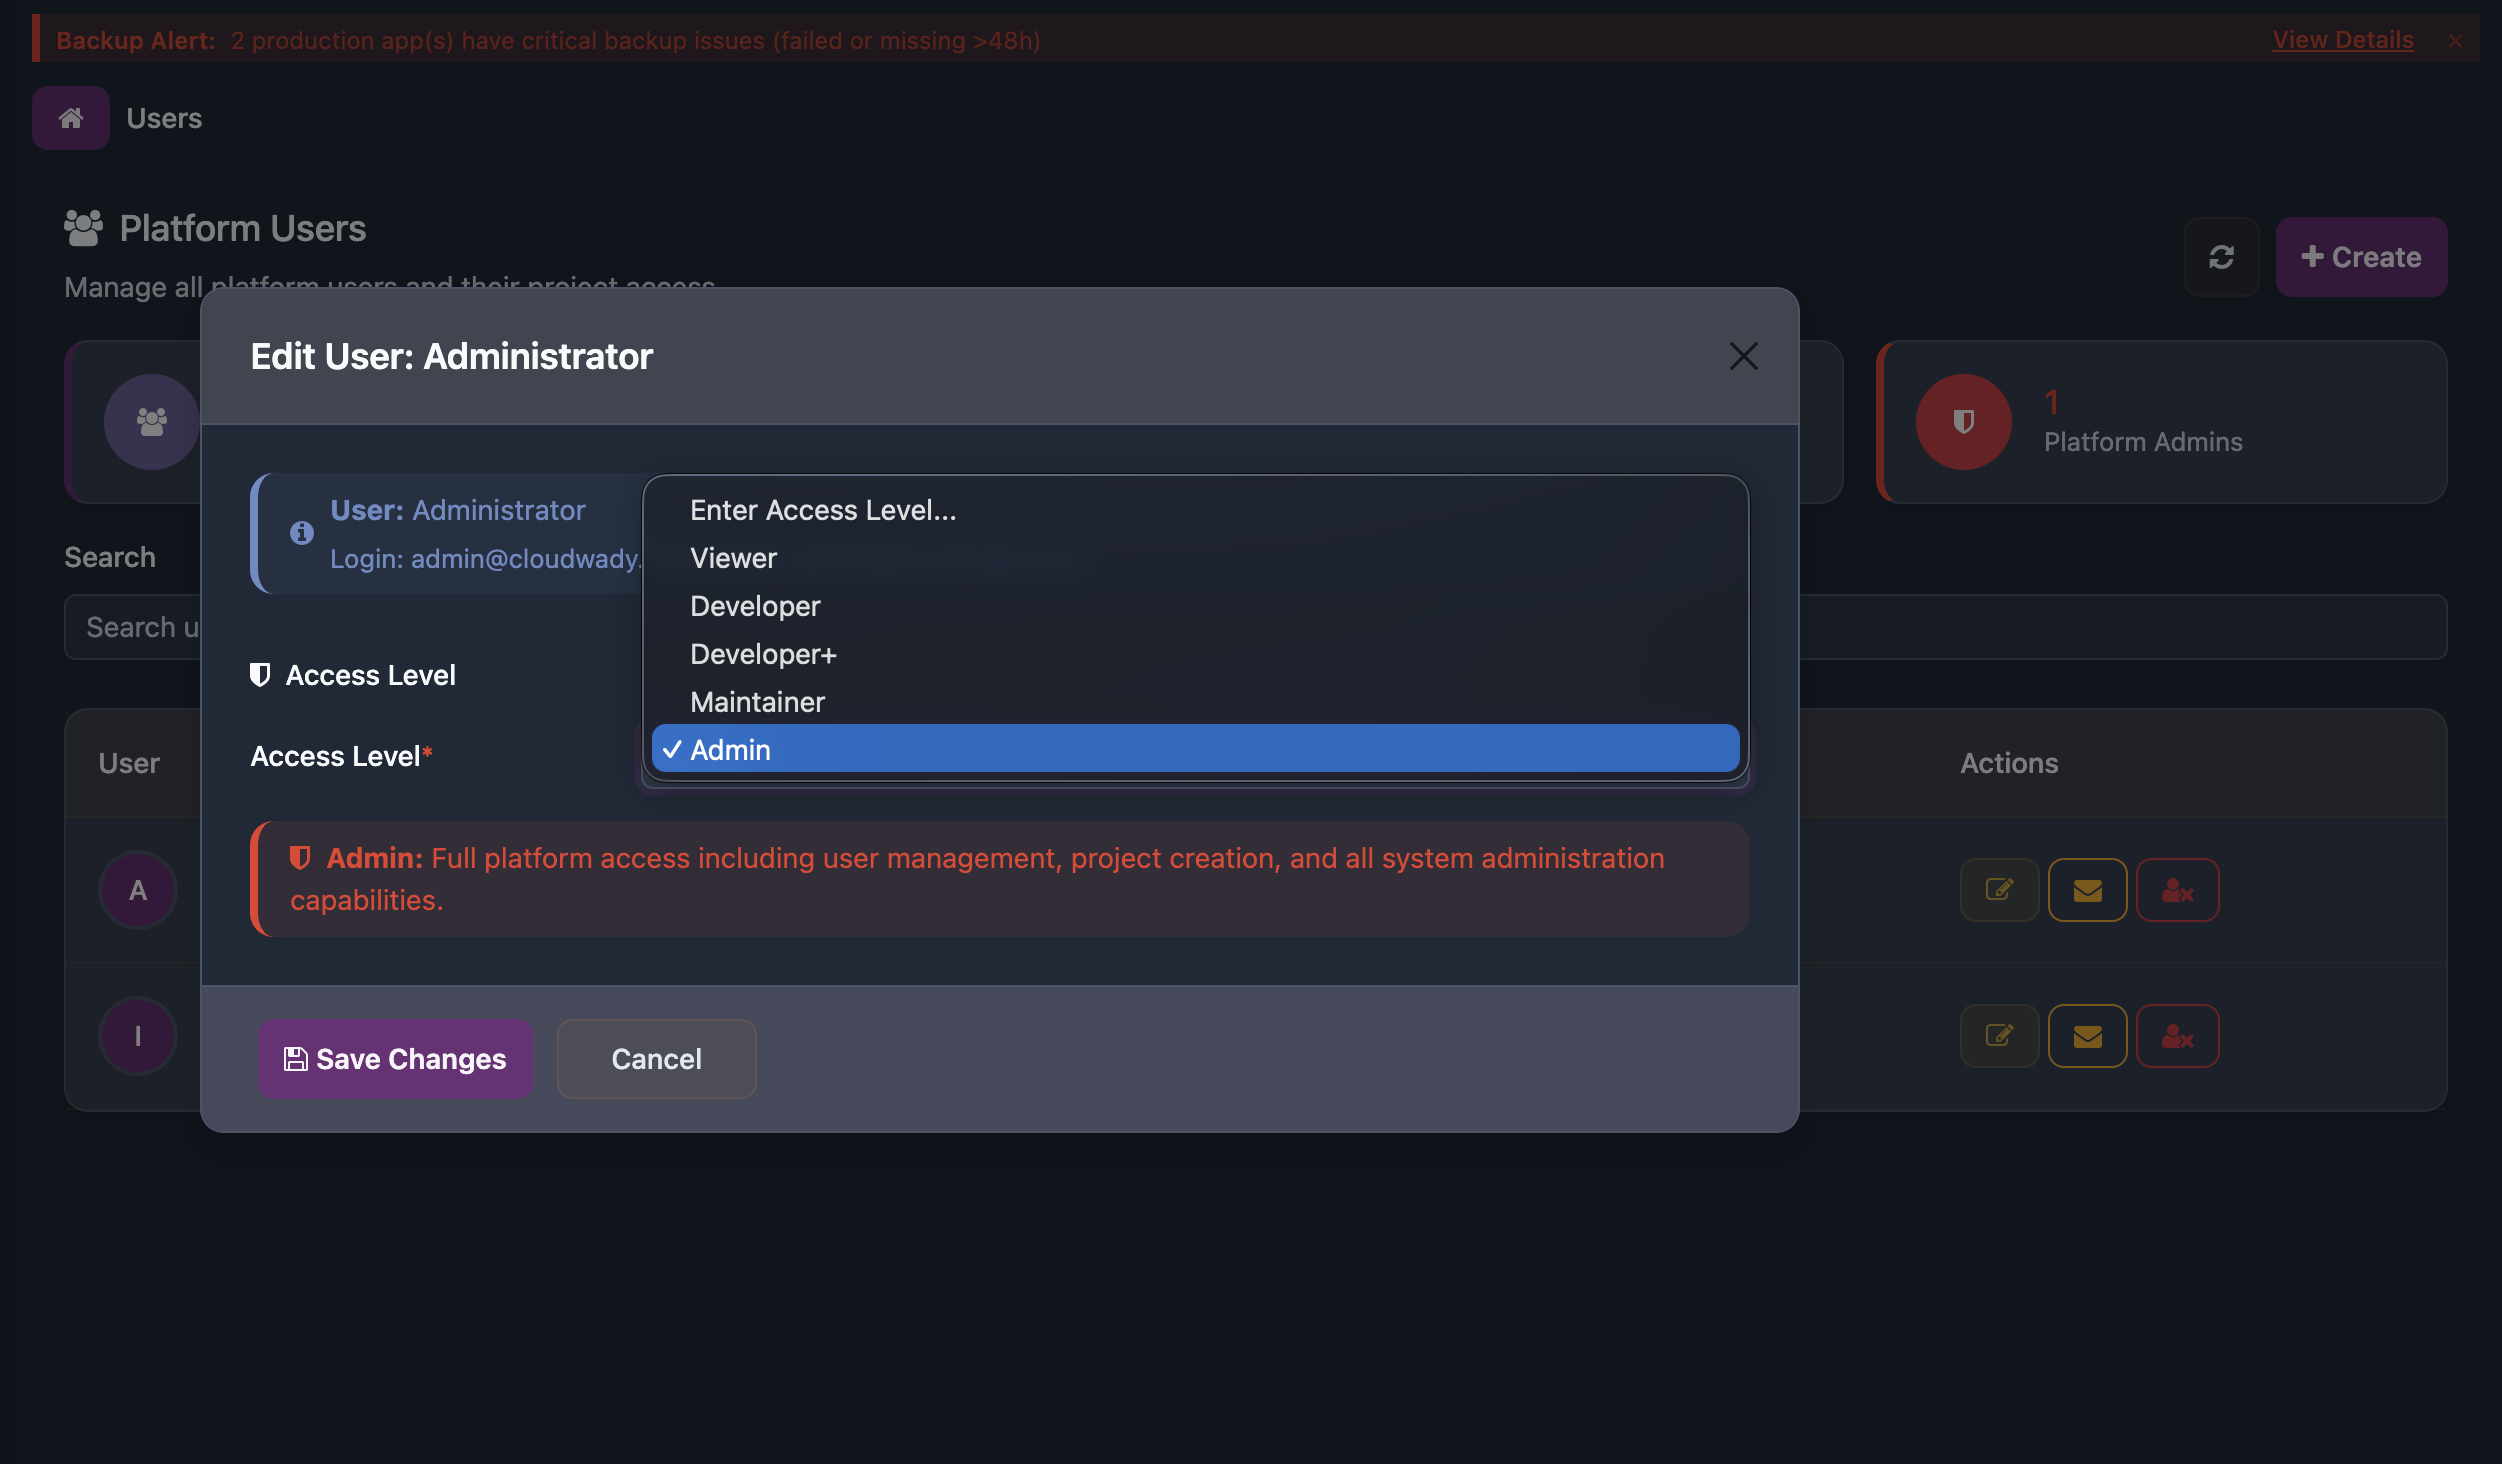
Click edit on any user to open the role dialog. Select an access level from the dropdown: Viewer, Developer, Developer Plus, Maintainer, or Admin. Each level includes a description of its permissions.
Available Actions
| Action | Description | Access Level |
|---|---|---|
| Refresh Users | Reload the user list | All |
| Add User / Create | Add a new user ("Add User" in project mode, "Create" in platform mode) | Admin |
| Search | Filter users by name or login | All |
| Access Level filter | Filter by role (All, Viewer, Developer, Developer+, Maintainer, Admin) | All |
| Edit | Open user dialog to change access level | Admin |
| Send Reset Password Email | Send a password reset email to the user | Admin |
| Remove from Project | Remove user's project access (project mode only) | Admin |
| Deactivate User | Deactivate user and remove SSH keys from all servers (platform mode only) | Admin |
App Overview & Actions
The application screen is where you manage an individual Odoo deployment with detailed configuration, deployment controls, and operational tools.
App Header
The header shows the app name, environment badge (PRODUCTION, STAGING, DEVELOPMENT), Odoo version, engine type, edition, and state badge. Quick action buttons are always available at the top.
App Sidebar Navigation
| Menu Item | Icon | Description |
|---|---|---|
| Overview | fa-info-circle | General info with tabs: General Info (Core), URLs (Routing), Configuration (Advanced), Automation (Pipeline) |
| Workflow | fa-sitemap | Workflow execution history |
| Deployment | fa-cube | Kubernetes resource management (only for K8s deploy method) |
| Backups | fa-database | Backup history and management |
| Restorations | fa-history | Restoration history |
| Variables | fa-cogs | Environment variable configuration (requires update permission) |
| Logger | fa-file-text-o | Application log viewer |
Overview Tabs
| Tab | Badge | Description |
|---|---|---|
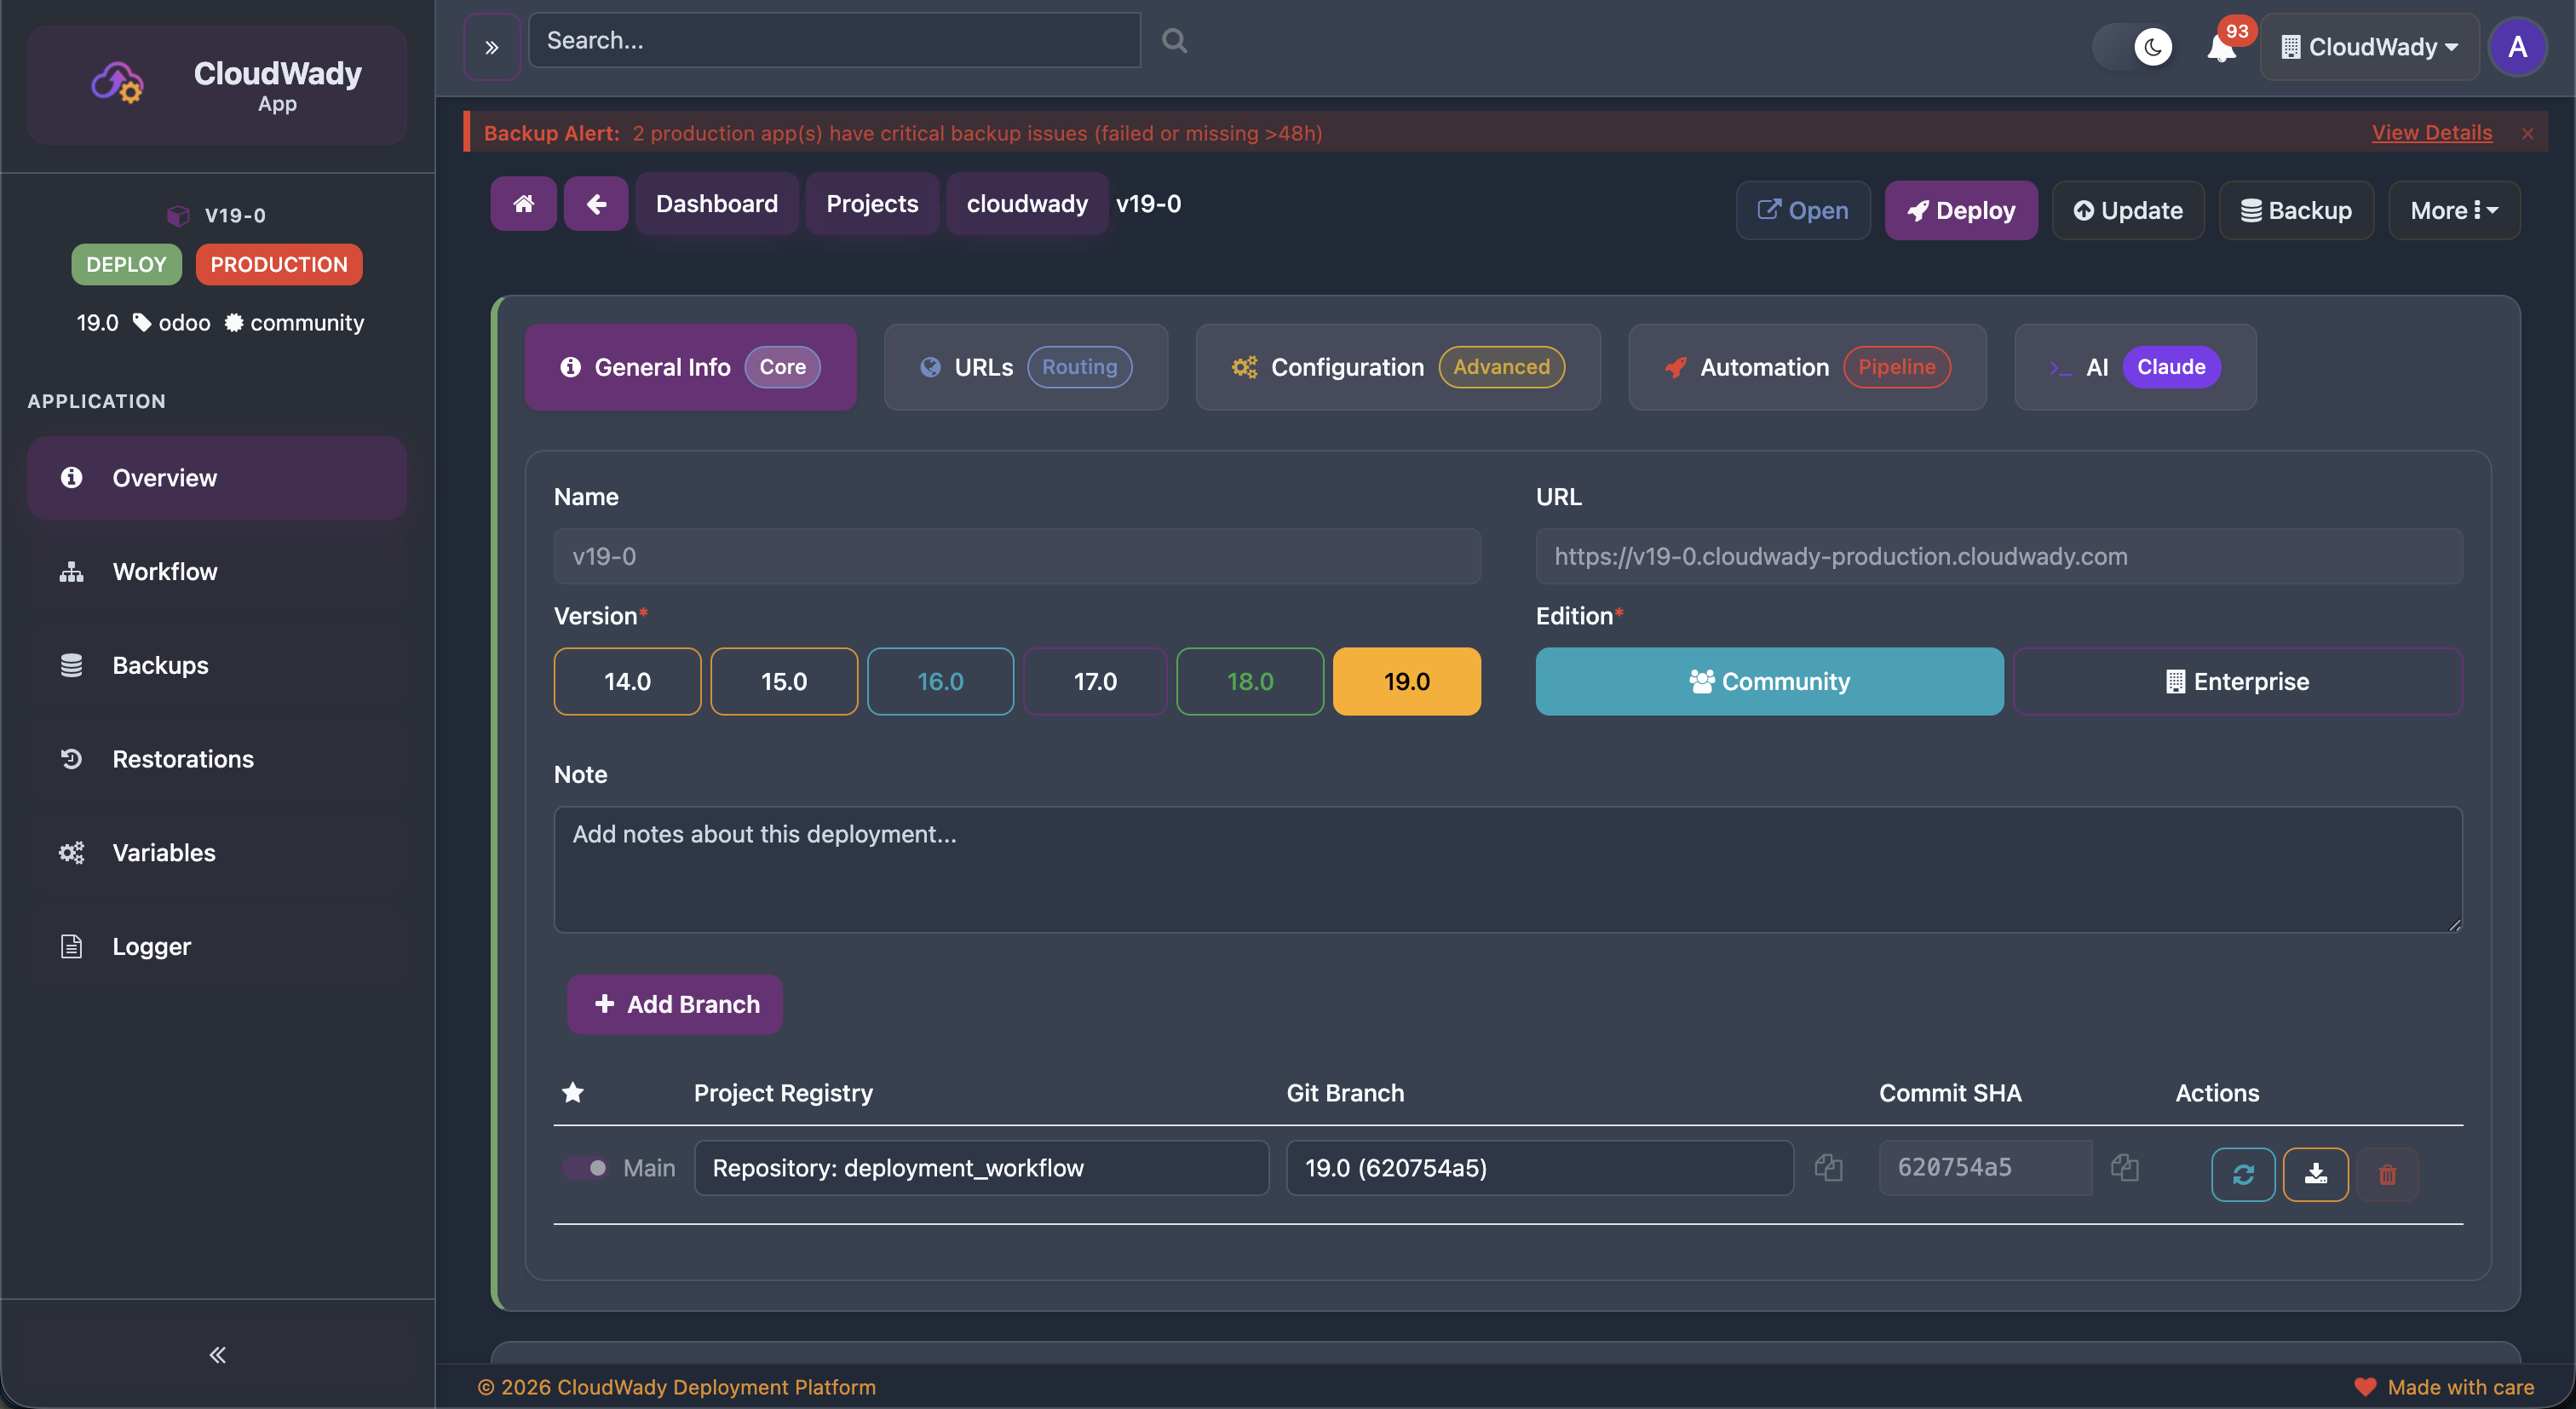
| General Info | Core | App name, URL, Odoo version, edition, notes, and branch table |
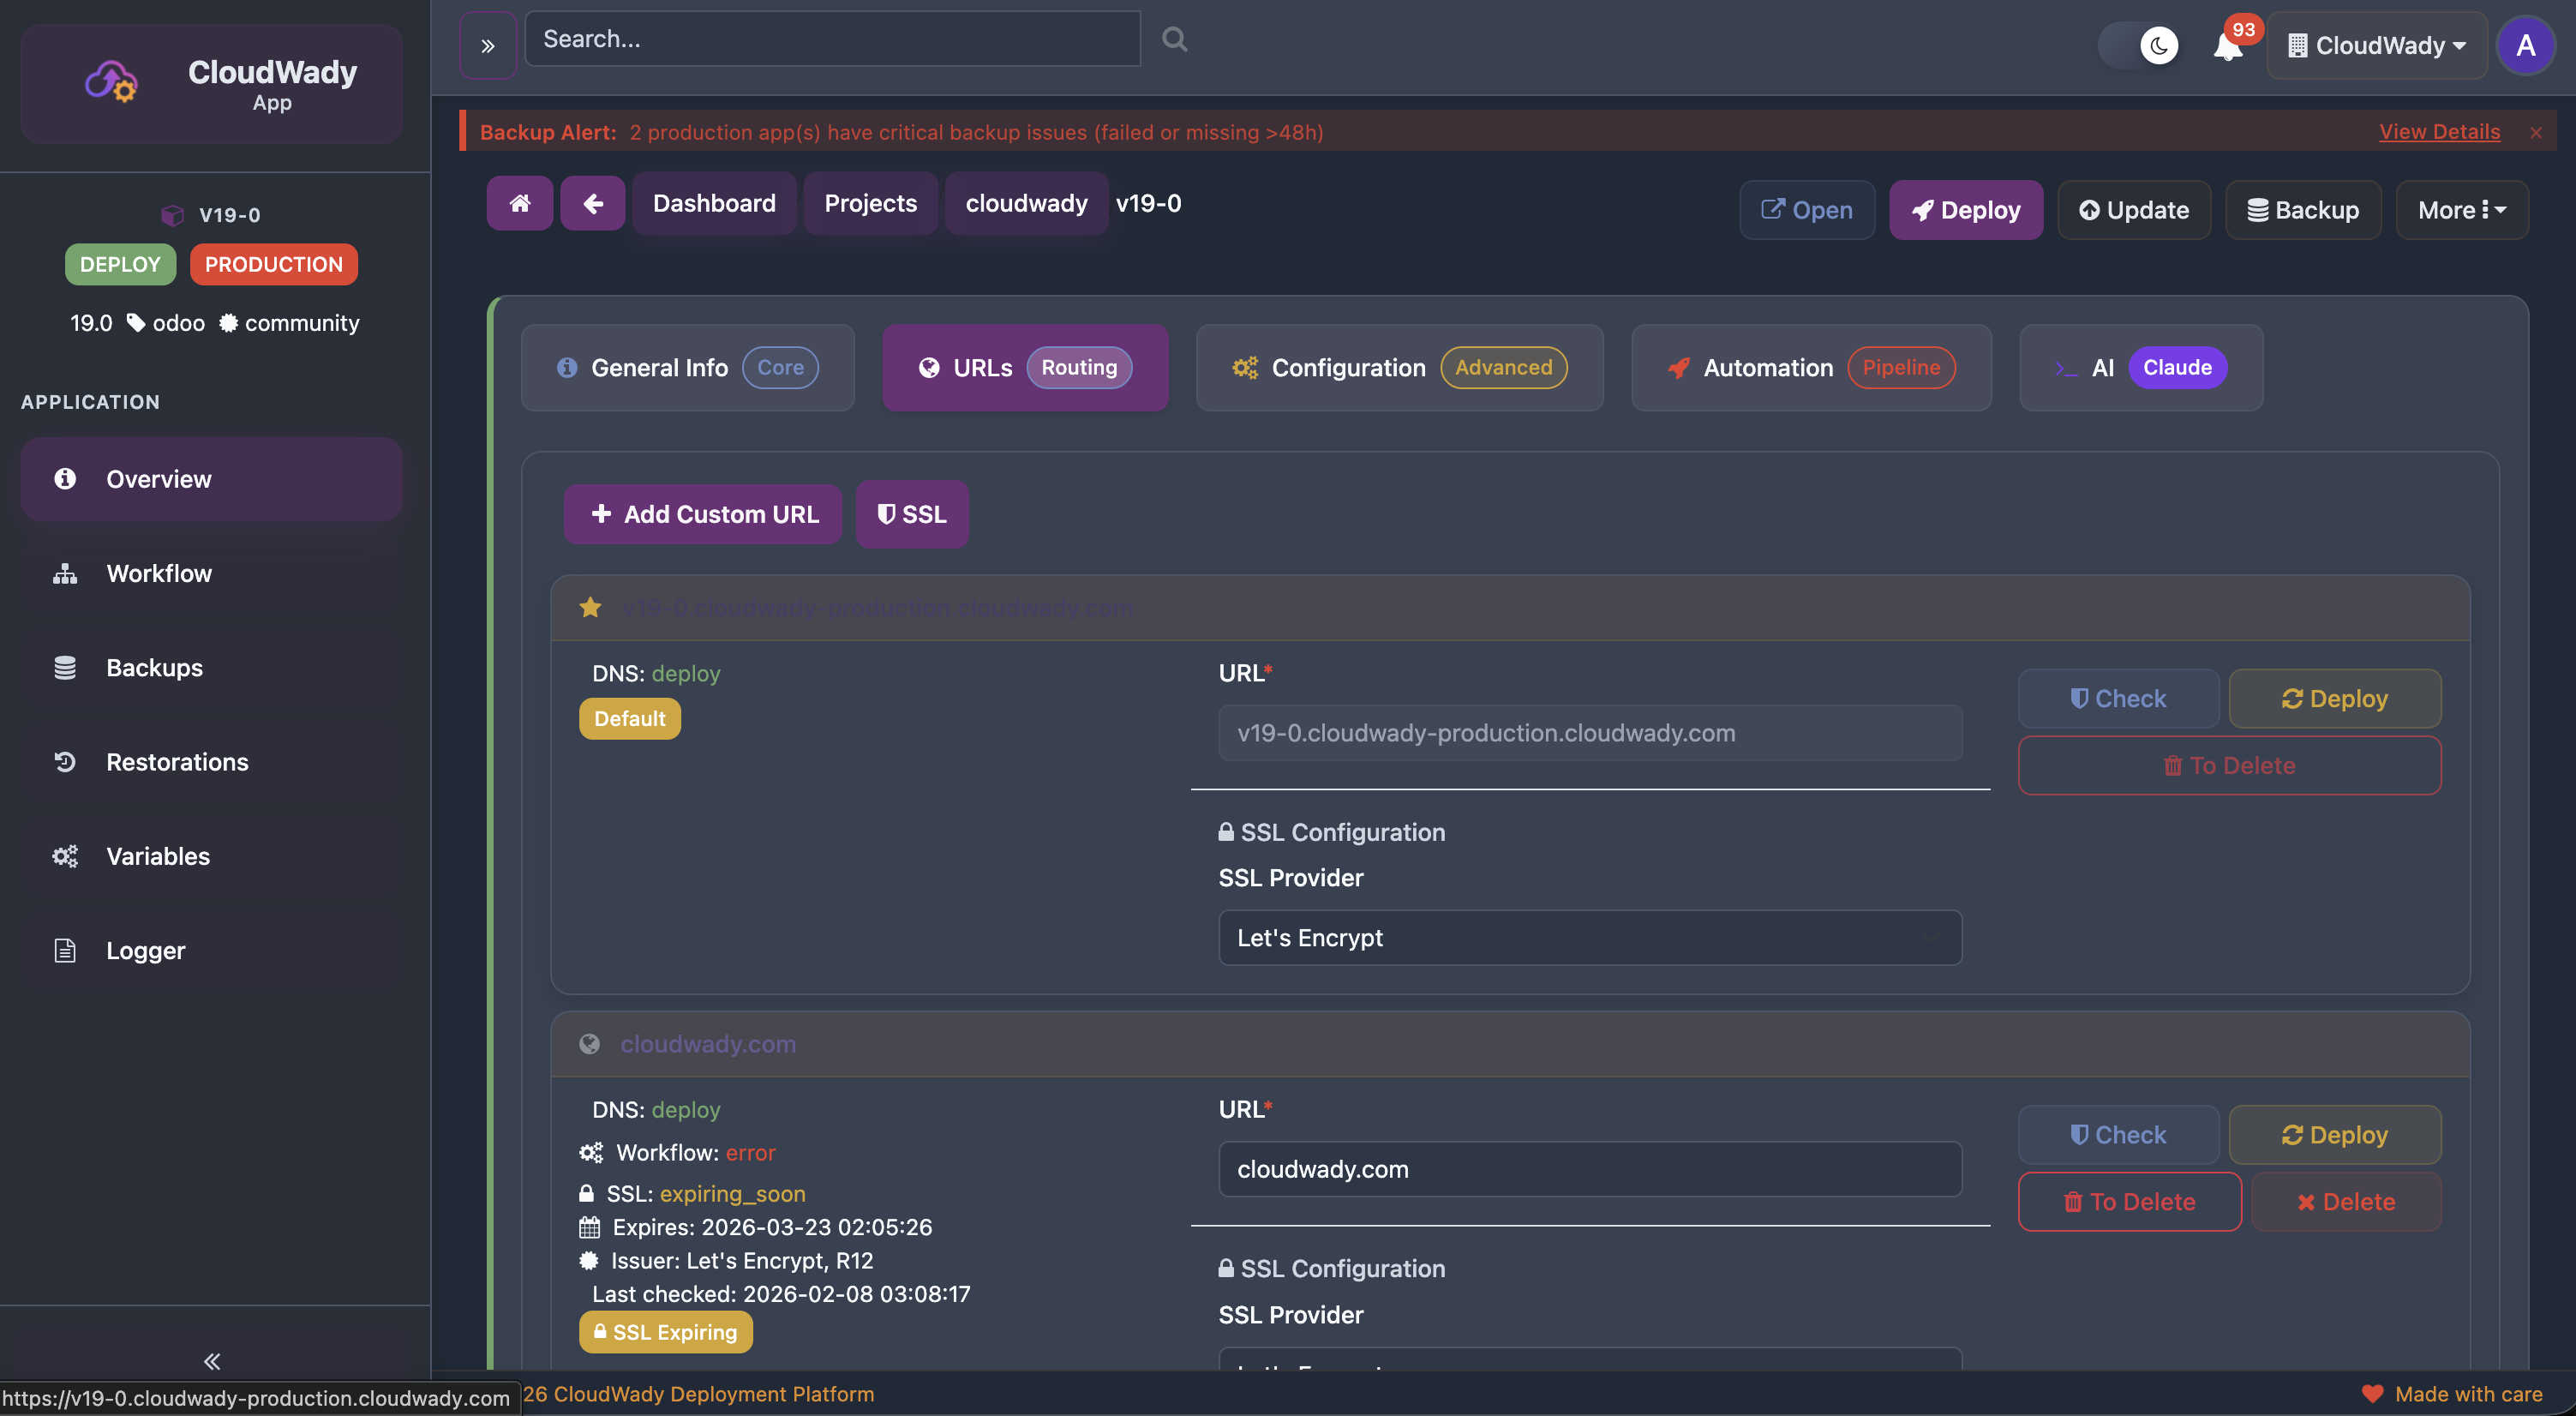
| URLs | Routing | Domain and URL management with SSL provider configuration |
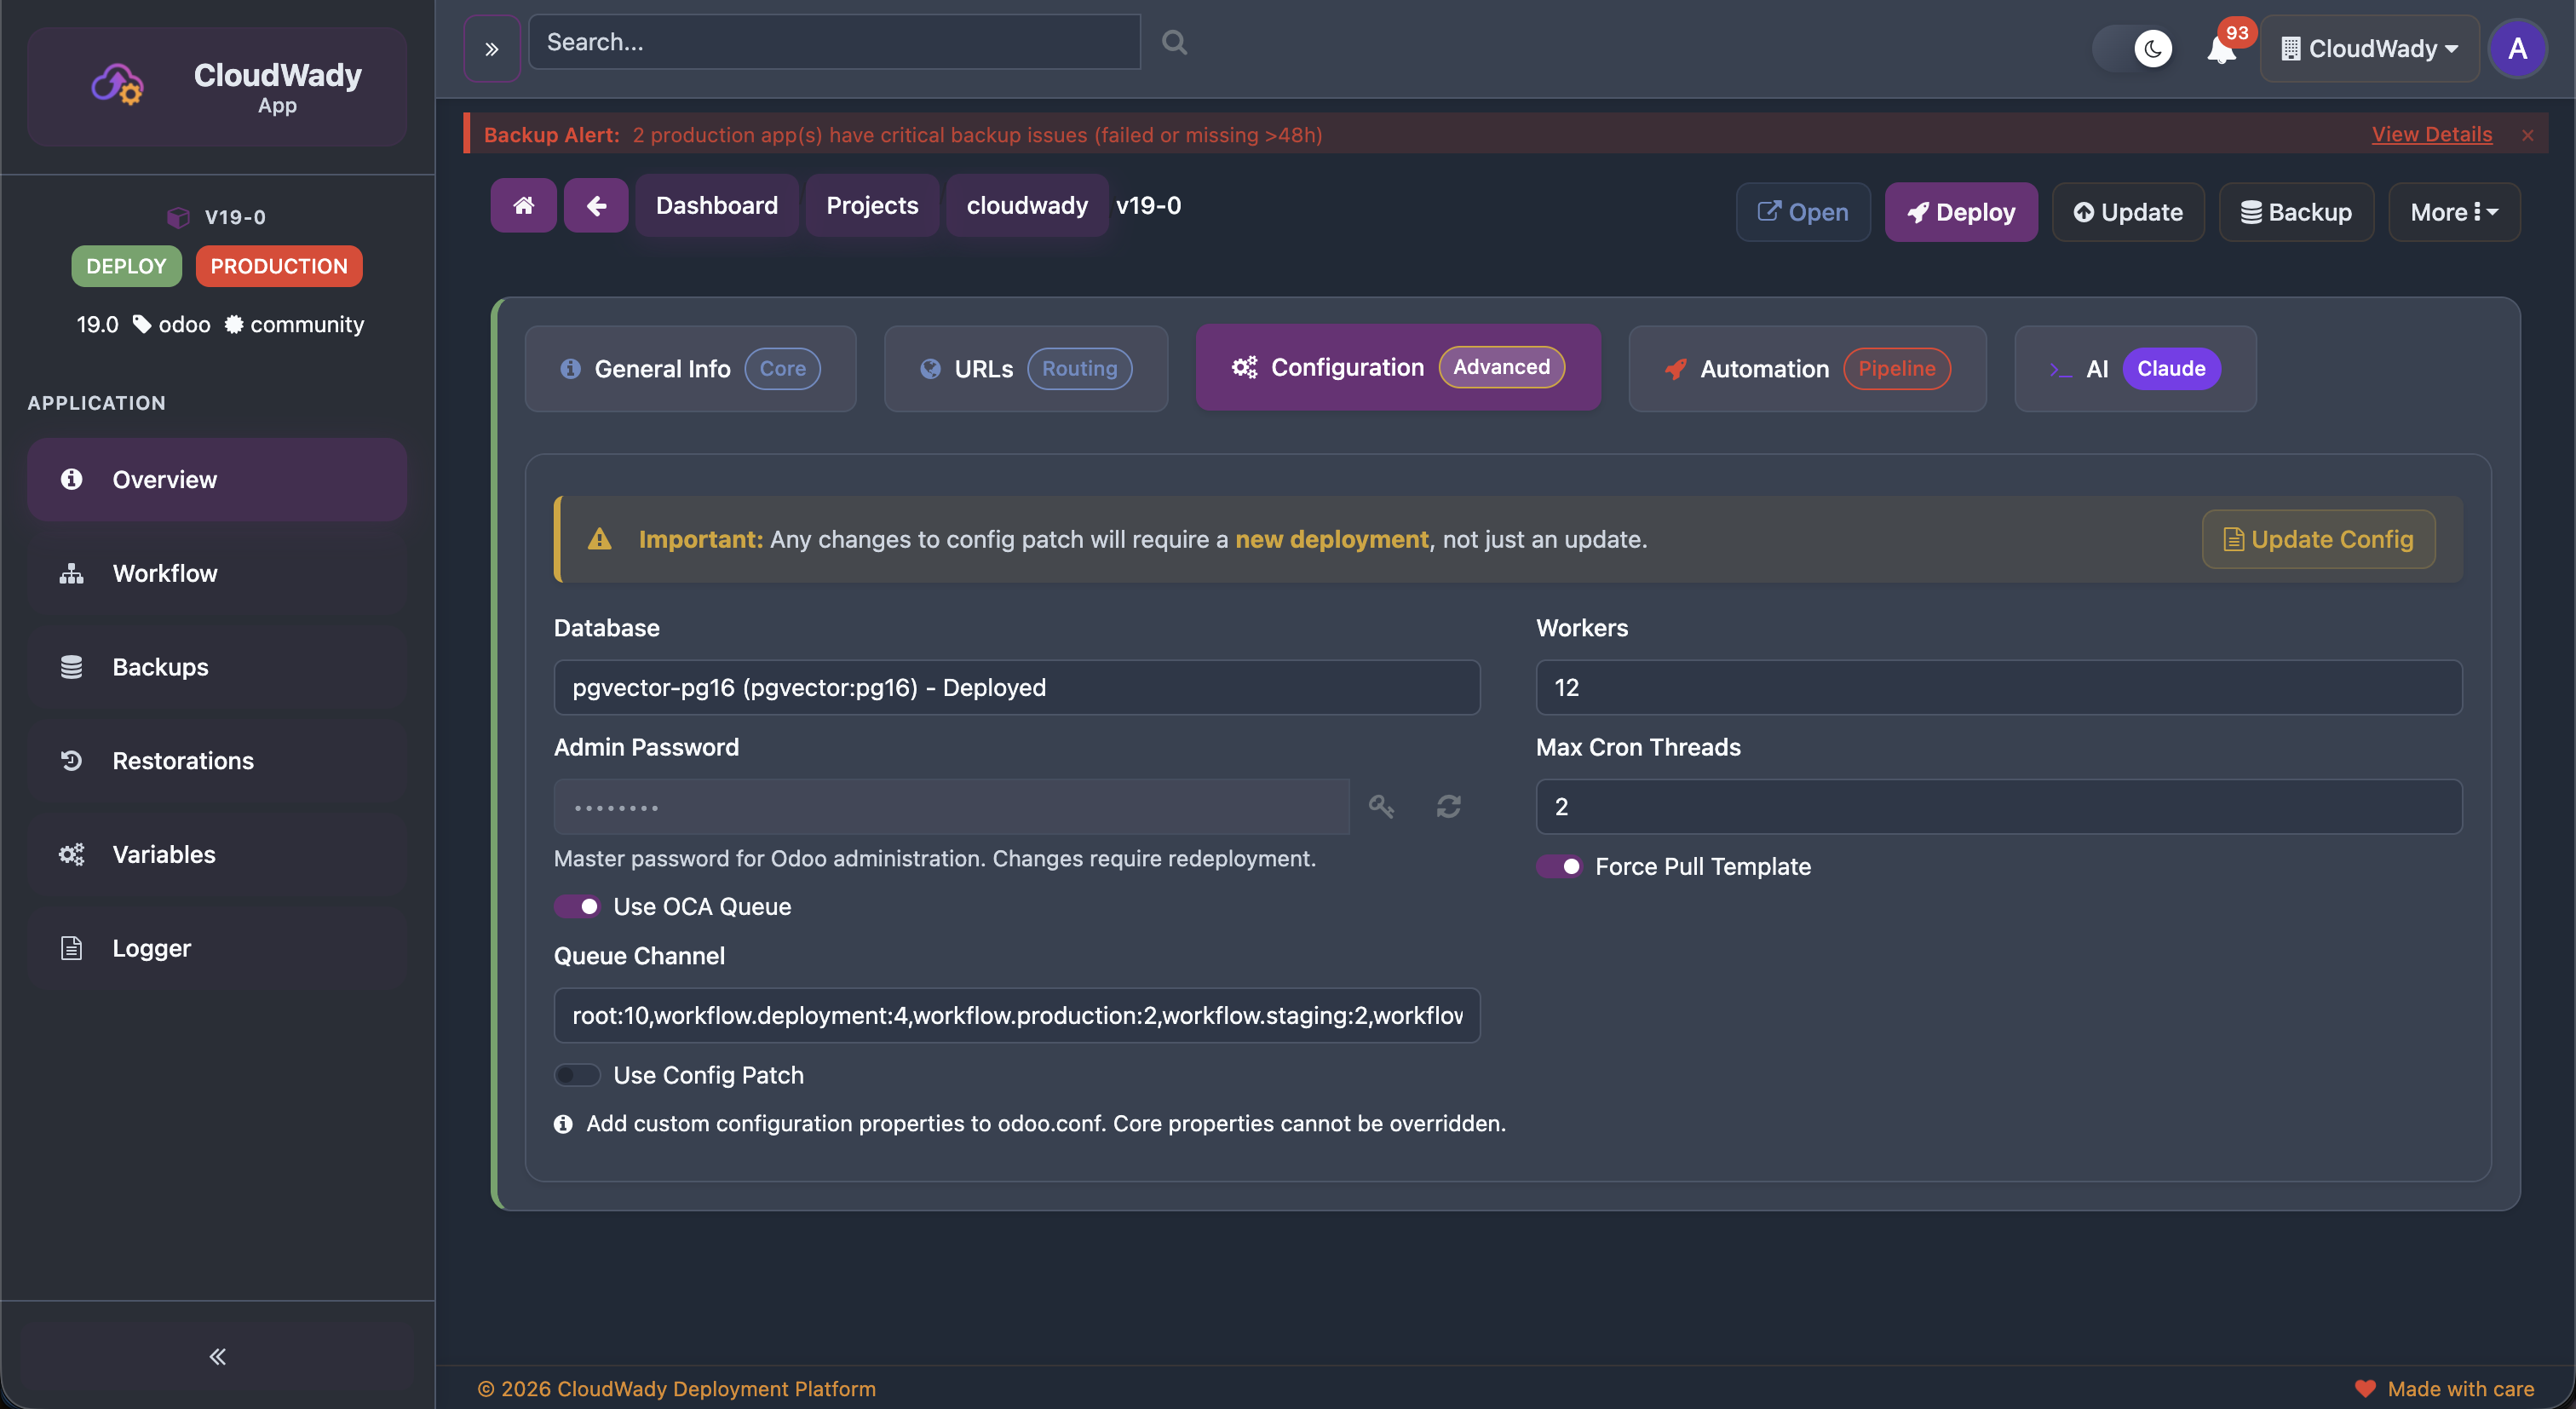
| Configuration | Advanced | Database, workers, queue settings, config patch |
| Automation | Pipeline | Auto-install, coverage, deadlines, backup scheduling |
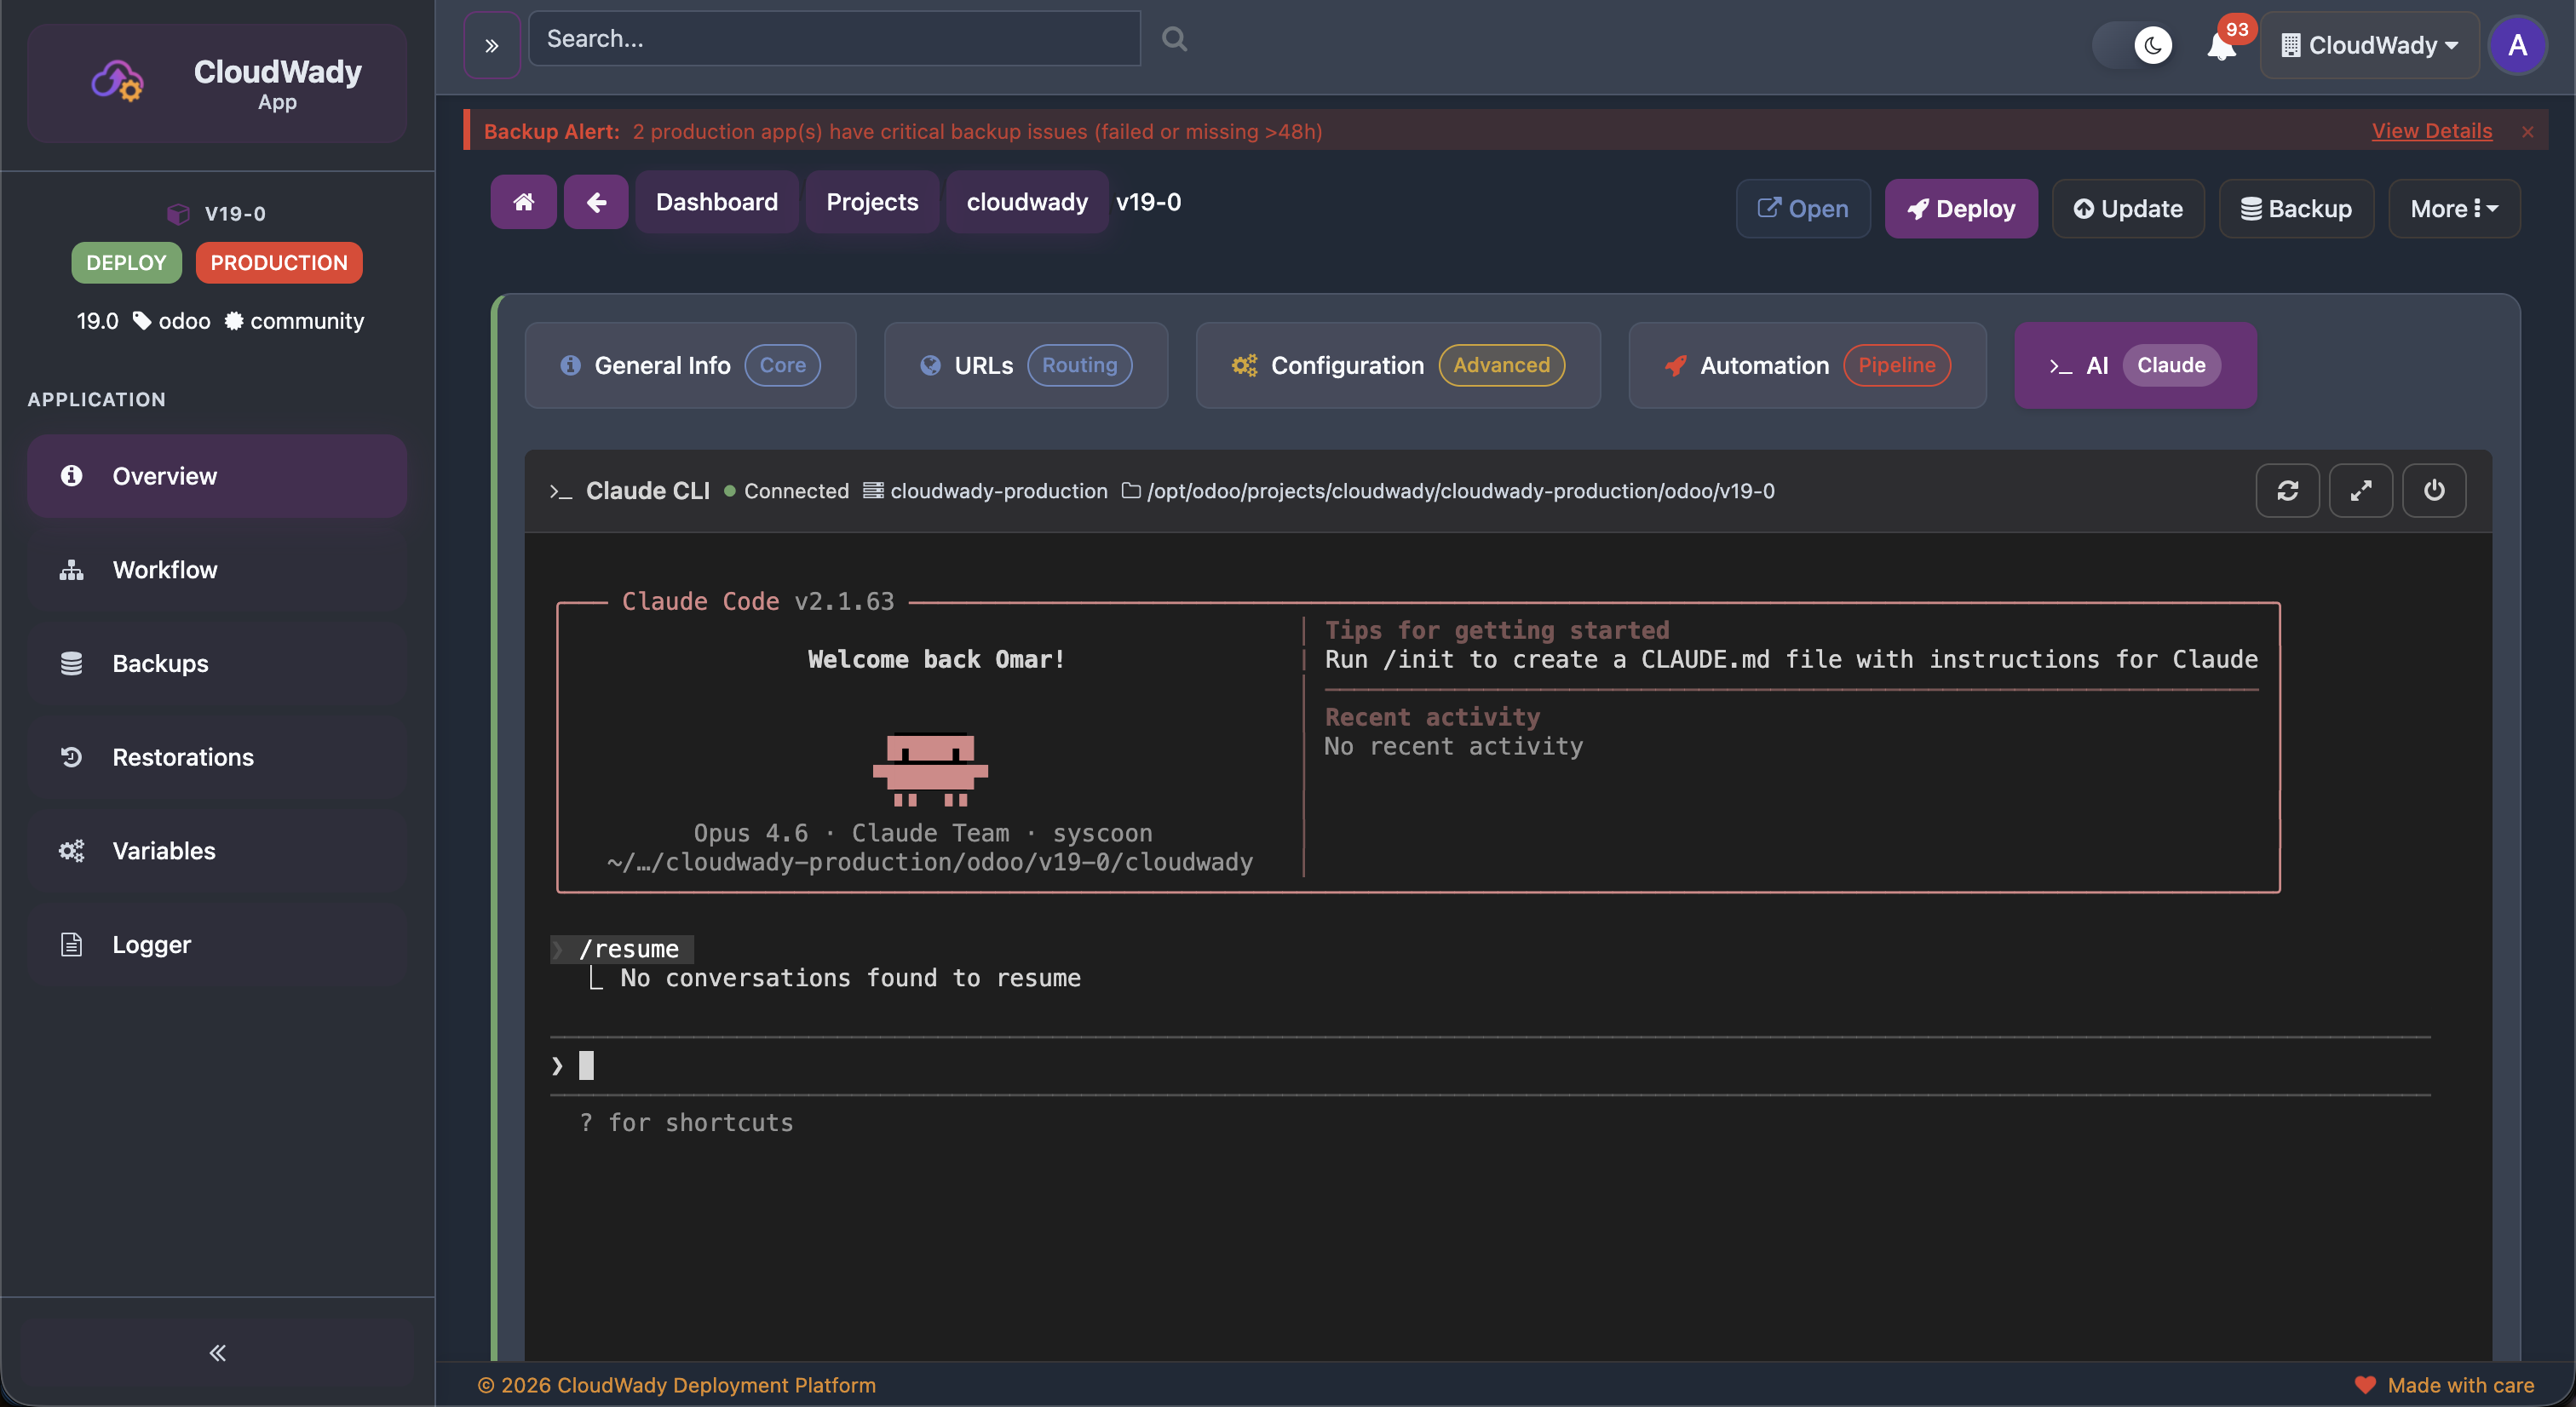
| AI | Claude | Inline Claude CLI terminal for running AI commands on the app's server (requires deployment_ai module) |
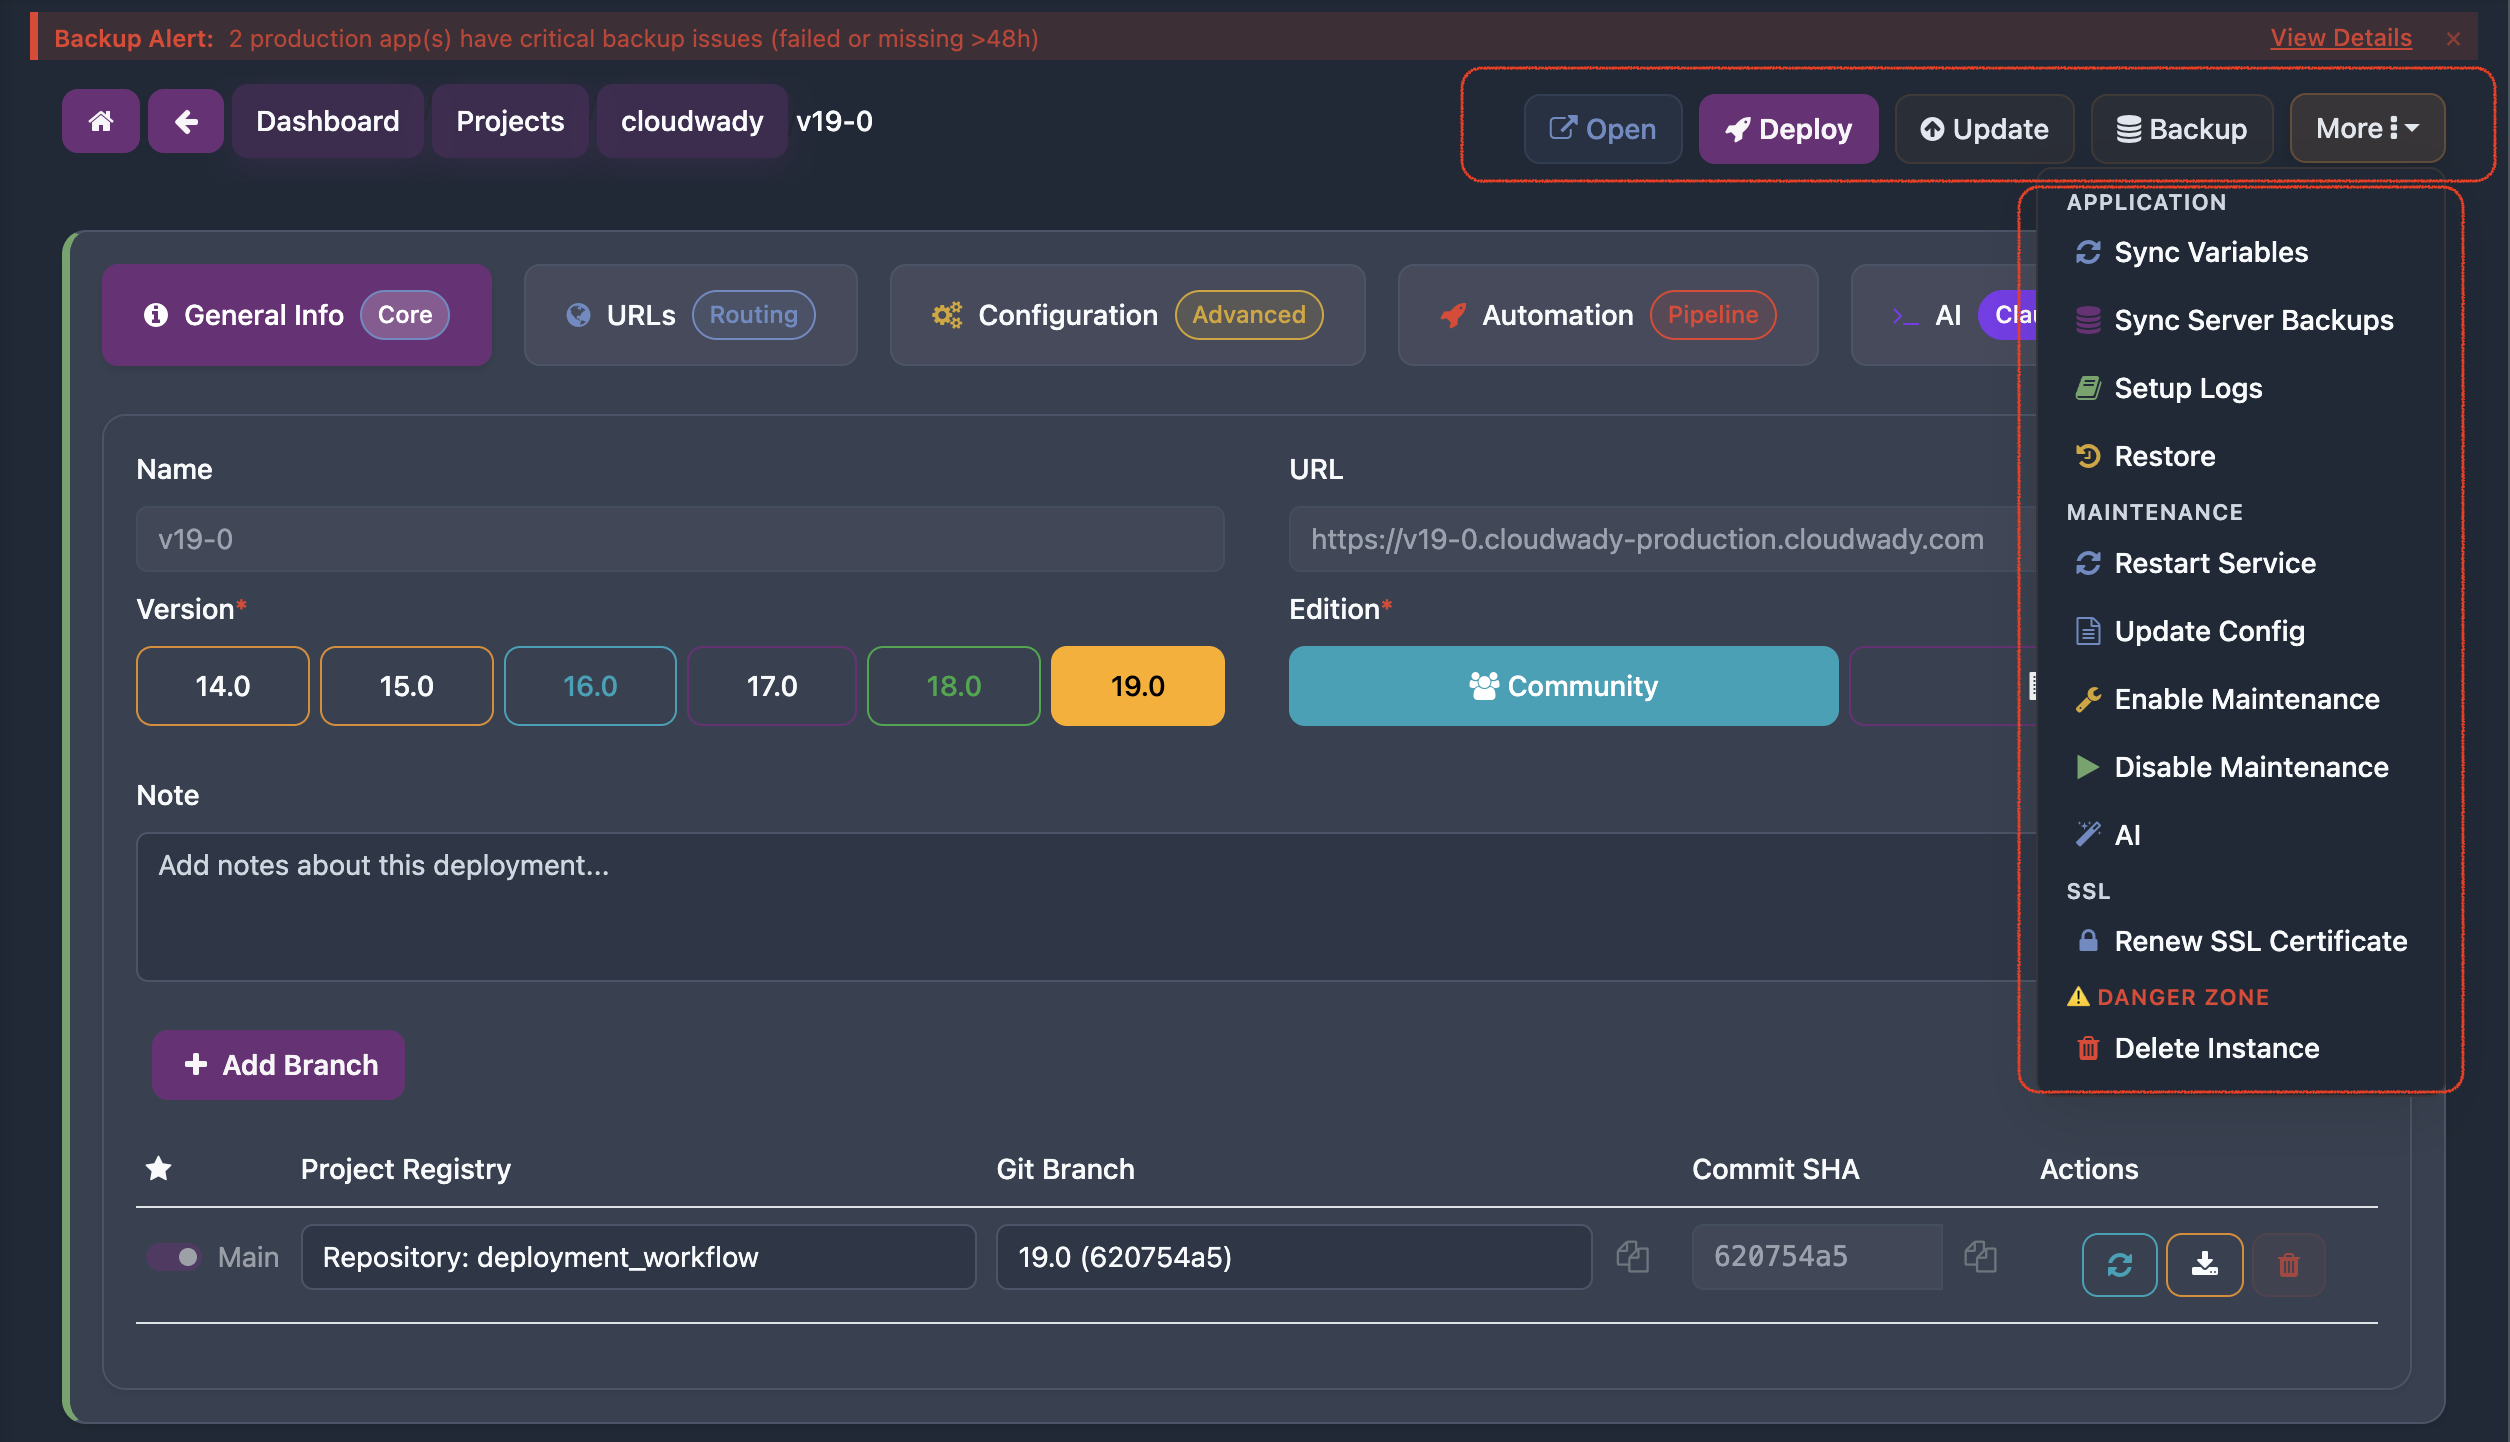
General Info Tab
URLs Tab
Configuration Tab
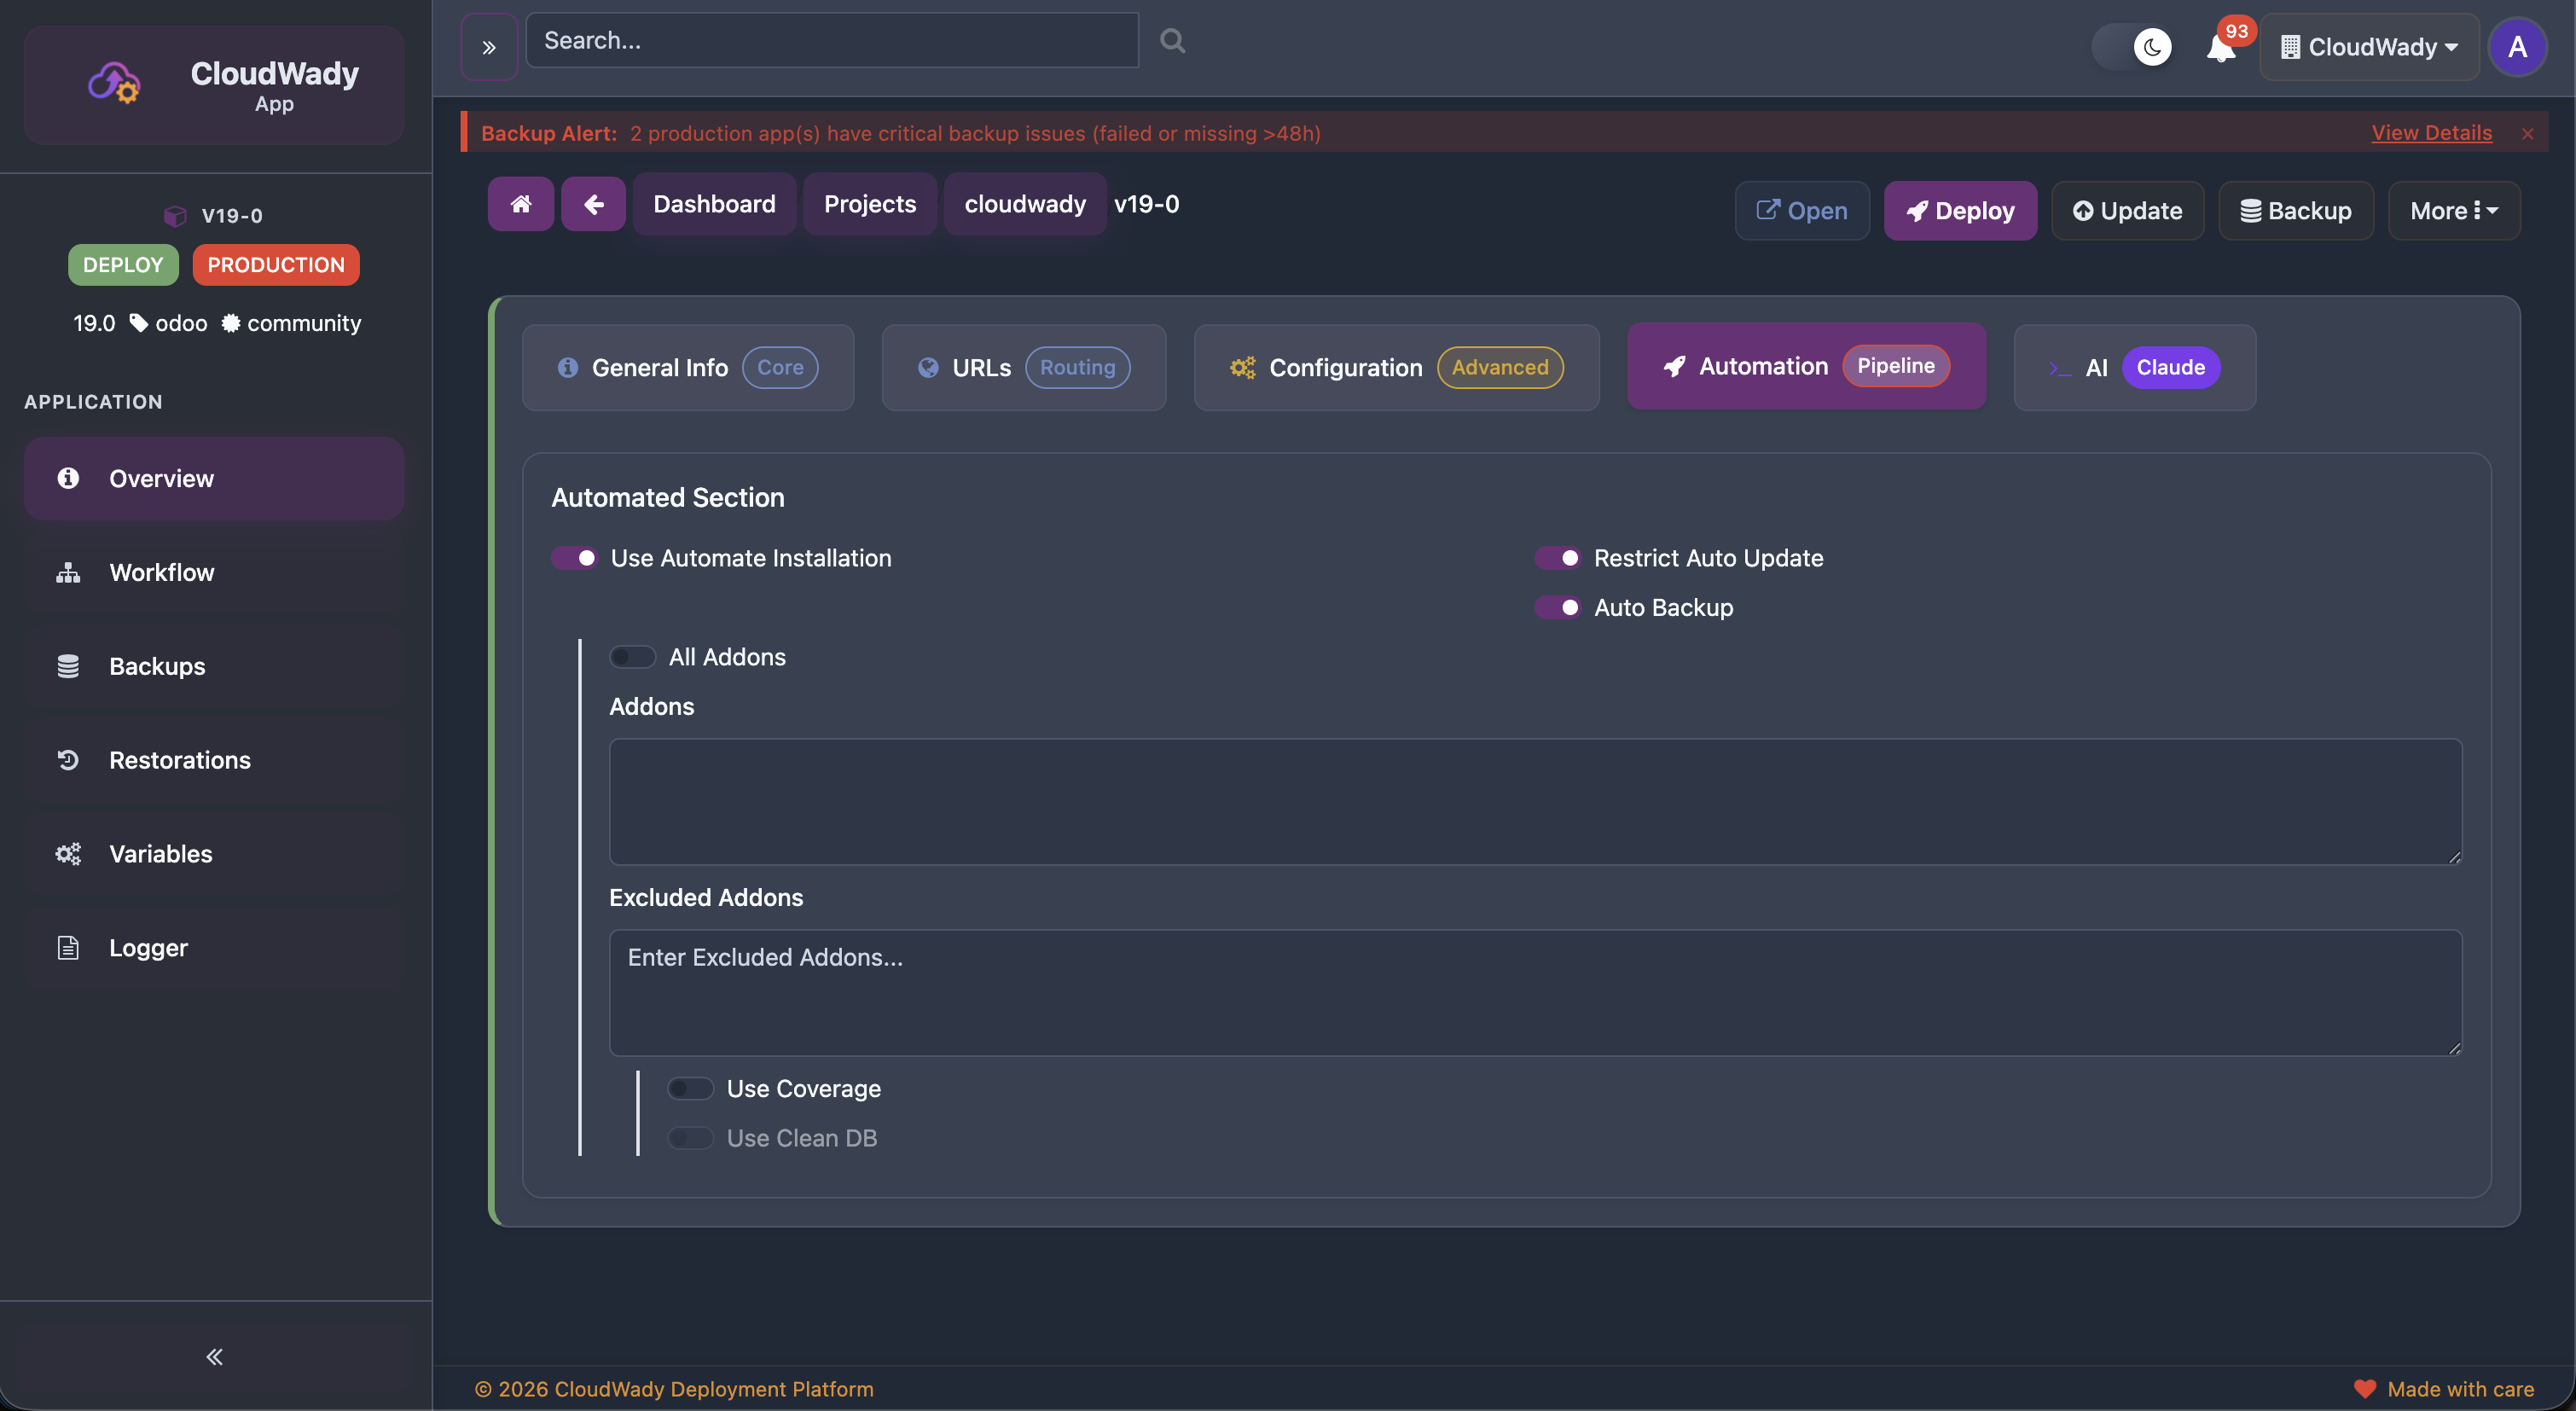
Automation Tab
AI Tab
Header Actions
| Action | Description | Access Level |
|---|---|---|
| Open | Launch the running Odoo instance in a new tab | All |
| Deploy | Full deployment: build Docker image, configure, and start | Developer+ (env-type specific) |
| Update | Pull latest code from Git branch and restart | Developer+ (env-type specific) |
| Backup | Create a database and filestore backup on demand | Developer+ (env-type specific) |
| Retry | Retry failed operation (only shown when state is error or canceled) | Developer+ (env-type specific) |
More Dropdown - Application Section
| Action | Description | Access Level |
|---|---|---|
| Sync Variables | Synchronize environment variables with the server | Developer+ |
| Sync Server Backups | Sync backup records with server storage | Developer+ |
| Setup Logs | Configure application logging | Developer+ |
| Restore | Initiate a restoration operation | Developer+ |
More Dropdown - Maintenance Section
| Action | Description | Access Level |
|---|---|---|
| Restart Service | Restart the running service without rebuilding (only when deployed) | Developer+ |
| Update Config | Push config changes without full redeploy (only when deployed, Docker method) | Developer+ |
| Enable Maintenance | Put app into maintenance mode | Developer+ |
| Disable Maintenance | Take app out of maintenance mode | Developer+ |
More Dropdown - SSL Section
| Action | Description | Access Level |
|---|---|---|
| Renew SSL Certificate | Trigger SSL certificate renewal for this app | Developer+ |
More Dropdown - Danger Zone
| Action | Description | Access Level |
|---|---|---|
| Delete Instance | Remove the deployed instance (when state is deploy or error) | Admin |
| Destroy | Destroy the app completely (when state is draft, delete, or disabled) | Admin |
Branch Actions
| Action | Description |
|---|---|
| Refresh SHA | Fetch latest commit SHA from Git |
| Download Addons | Download addon source files from the branch |
| Copy Branch Name | Copy branch name to clipboard |
| Copy SHA | Copy the full commit SHA to clipboard |
| Delete | Remove branch connection (non-main branches only) |
URLs Tab Actions
| Action | Description |
|---|---|
| Add New URL | Add a new URL/domain entry |
| Deploy SSL Certificates | Deploy SSL certs for all URLs (if SSL provider set) |
| Check SSL | Check SSL certificate status per URL |
| Download from Storage | Download SSL cert from storage |
| Upload to Storage | Upload SSL cert to storage |
| Renew SSL | Renew certificate for a specific URL |
| Delete URL | Remove URL entry (disabled for primary URL) |
Configuration Tab Fields
Key configuration fields include: Database selection, Admin password (with Get Password and Regenerate Password actions), Workers count, Max cron threads, Force pull template, OCA Queue toggle with channel config, and Config patch (custom Odoo configuration).
Automation Tab Fields
Automation settings include: Automatic installation toggle, Restrict auto-update, Auto backup scheduling, Deadline date (non-production), All/select addons, Excluded addons, Coverage analysis, and Clean database option.
Configuration & Variables
The Variables section in the app sidebar lets you view and manage all environment variables available to your Odoo instance at runtime.
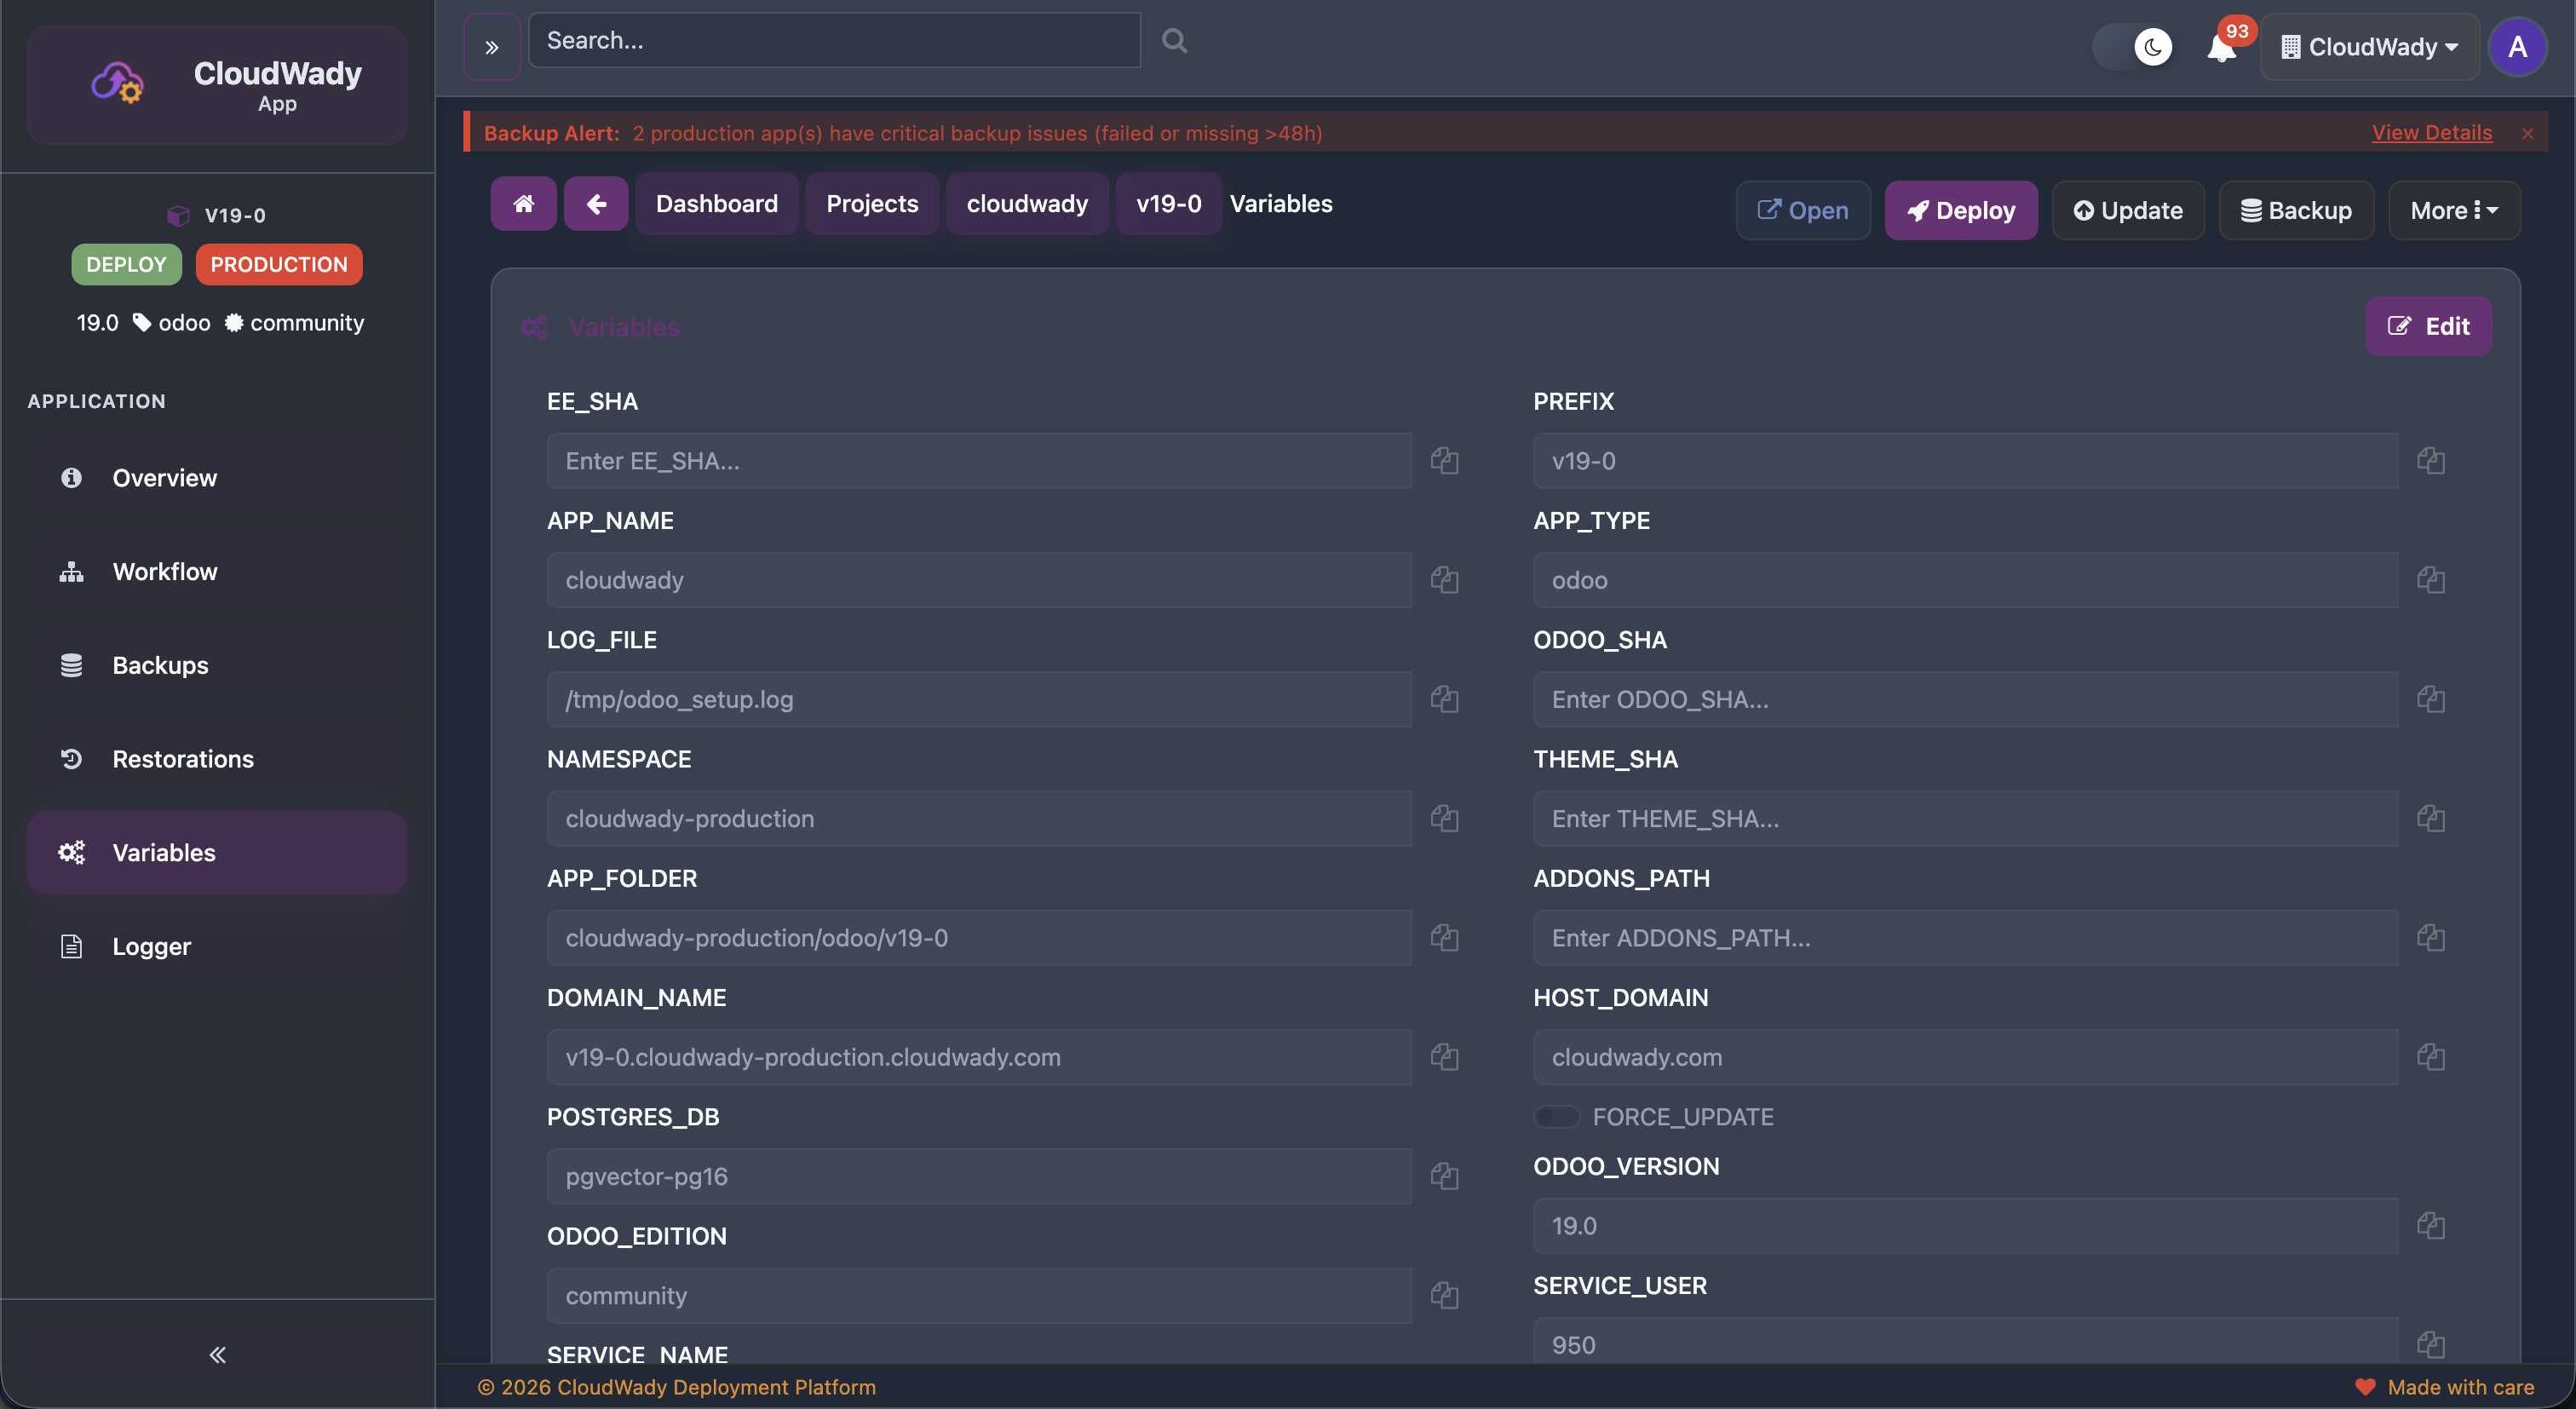
Variable Categories
Variables are displayed in a two-column layout showing name-value pairs.
Each variable has a copy icon for quick clipboard access.
Available Actions
| Action | Description | Access Level |
|---|---|---|
| Edit | Toggle edit mode to modify variable values | Developer+ |
| Copy | Copy individual variable value to clipboard | All |
Branches & Git Integration
CloudWady integrates with GitHub via the GitHub App for automatic branch tracking and webhook-based deployments.
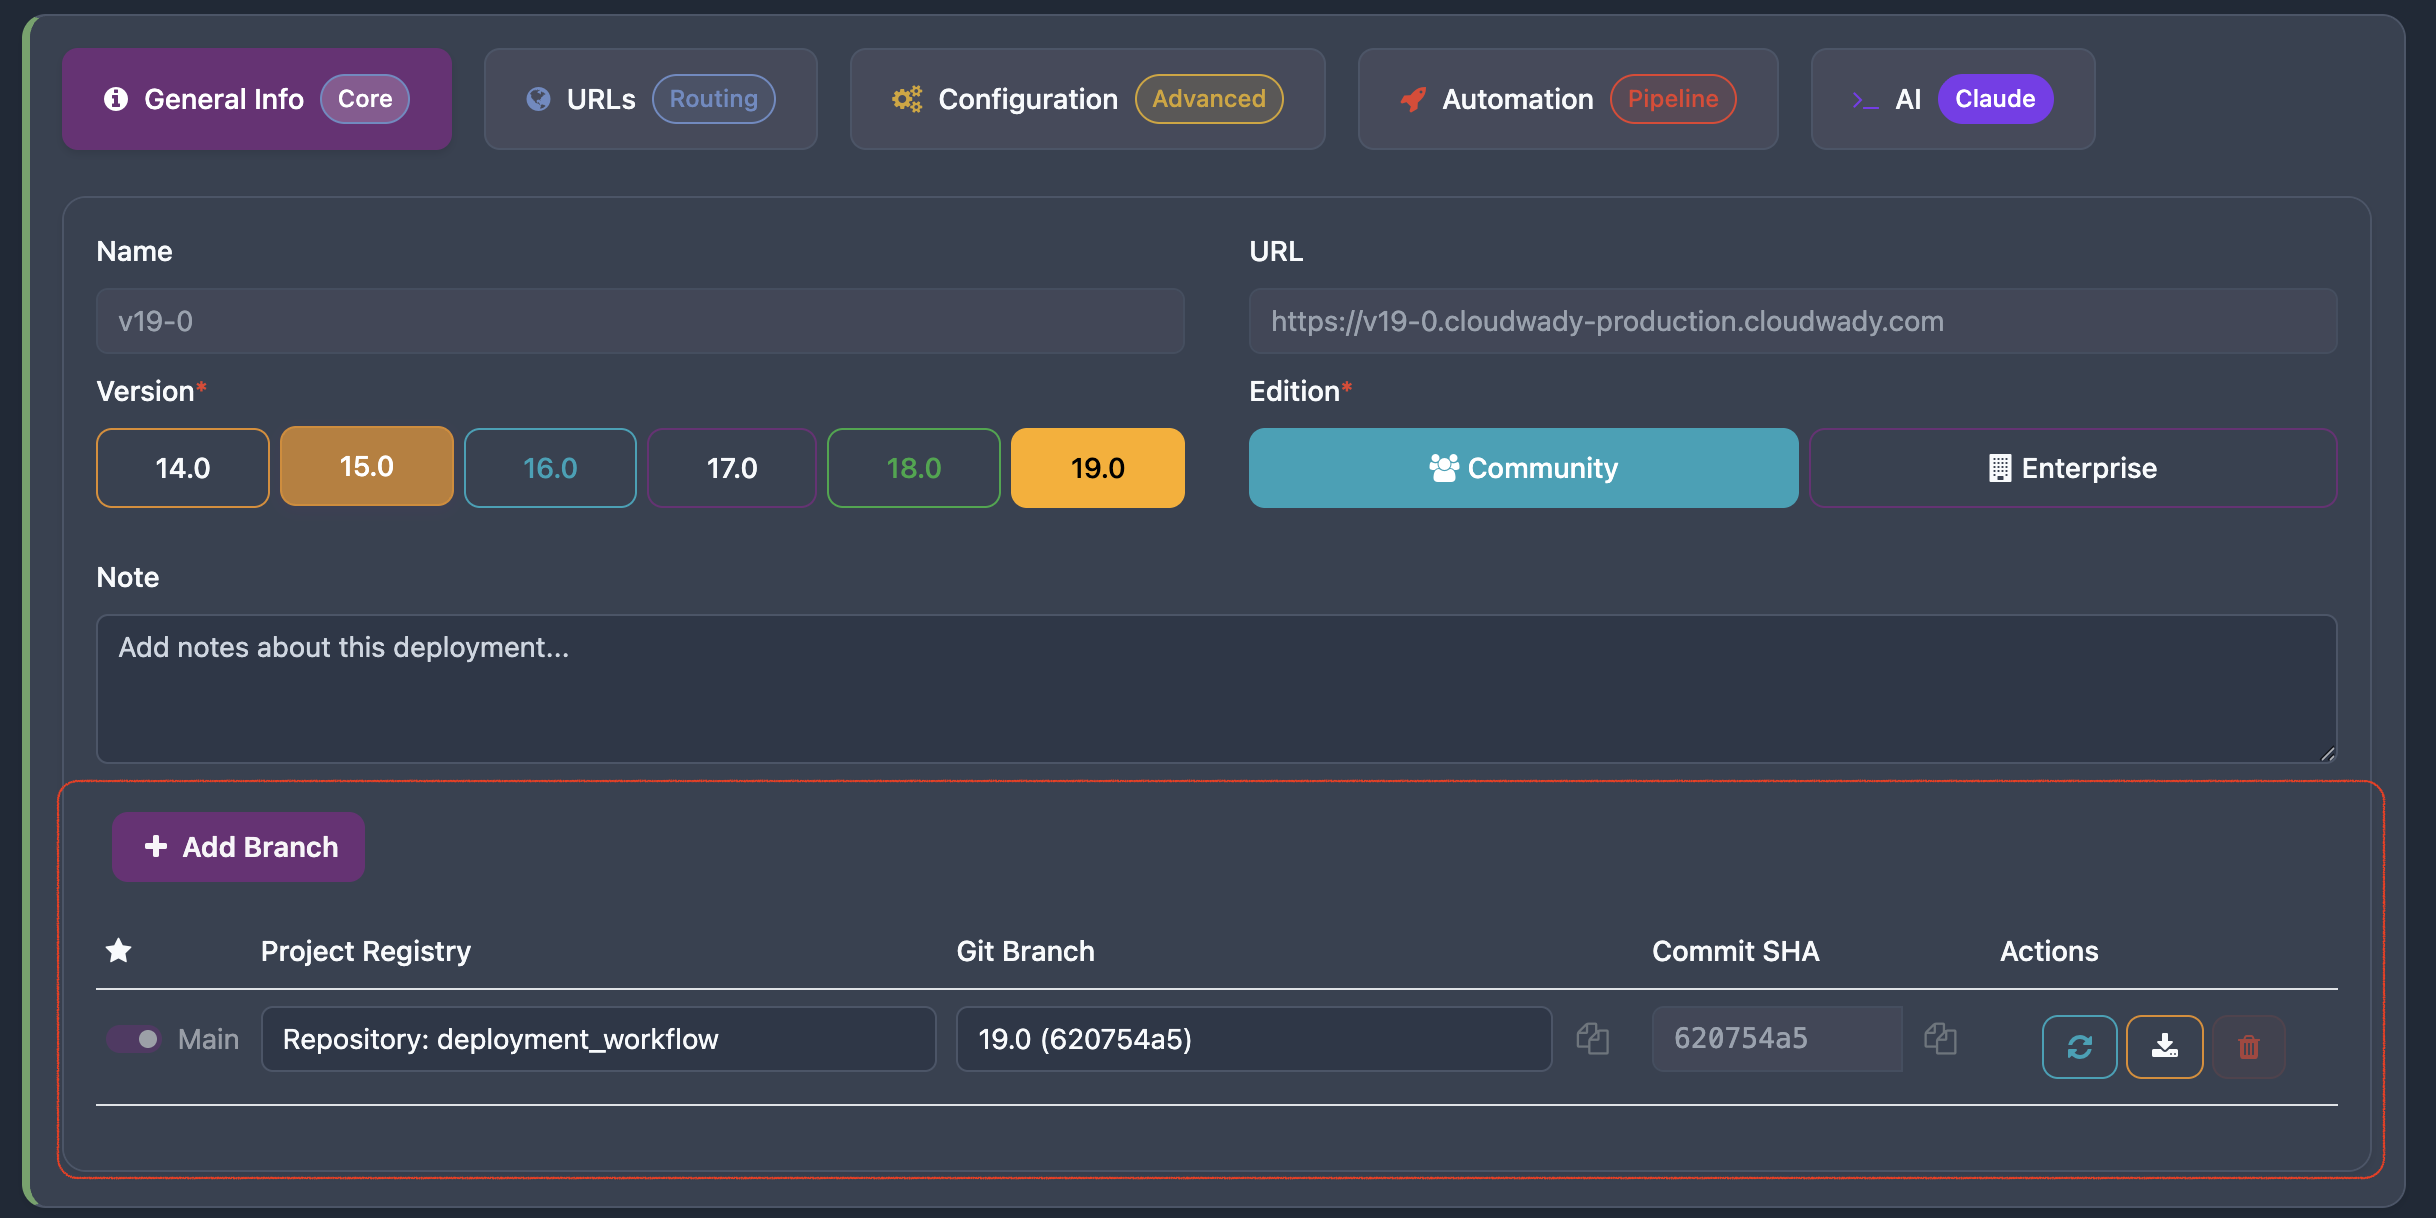
Branch Table
The branch table shows all connected Git branches with columns:
- Main flag: Indicates the primary branch used for deployments.
- Project Registry: The connected Git repository.
- Git Branch: Branch name with the latest commit SHA in parentheses.
- Commit SHA: Full commit hash with copy action.
- Actions: Refresh SHA, Download Addons, Copy, and Delete operations.
GitHub App Connection
- Install the CloudWady GitHub App on your organization.
- Select which repositories to grant access to.
- Branches are automatically discovered and tracked.
- Pushes to your branch can automatically trigger deployments via webhooks.
Workflows & Deployment
The Workflow section shows the execution history of all automation tasks for your application, powered by Ansible playbooks.
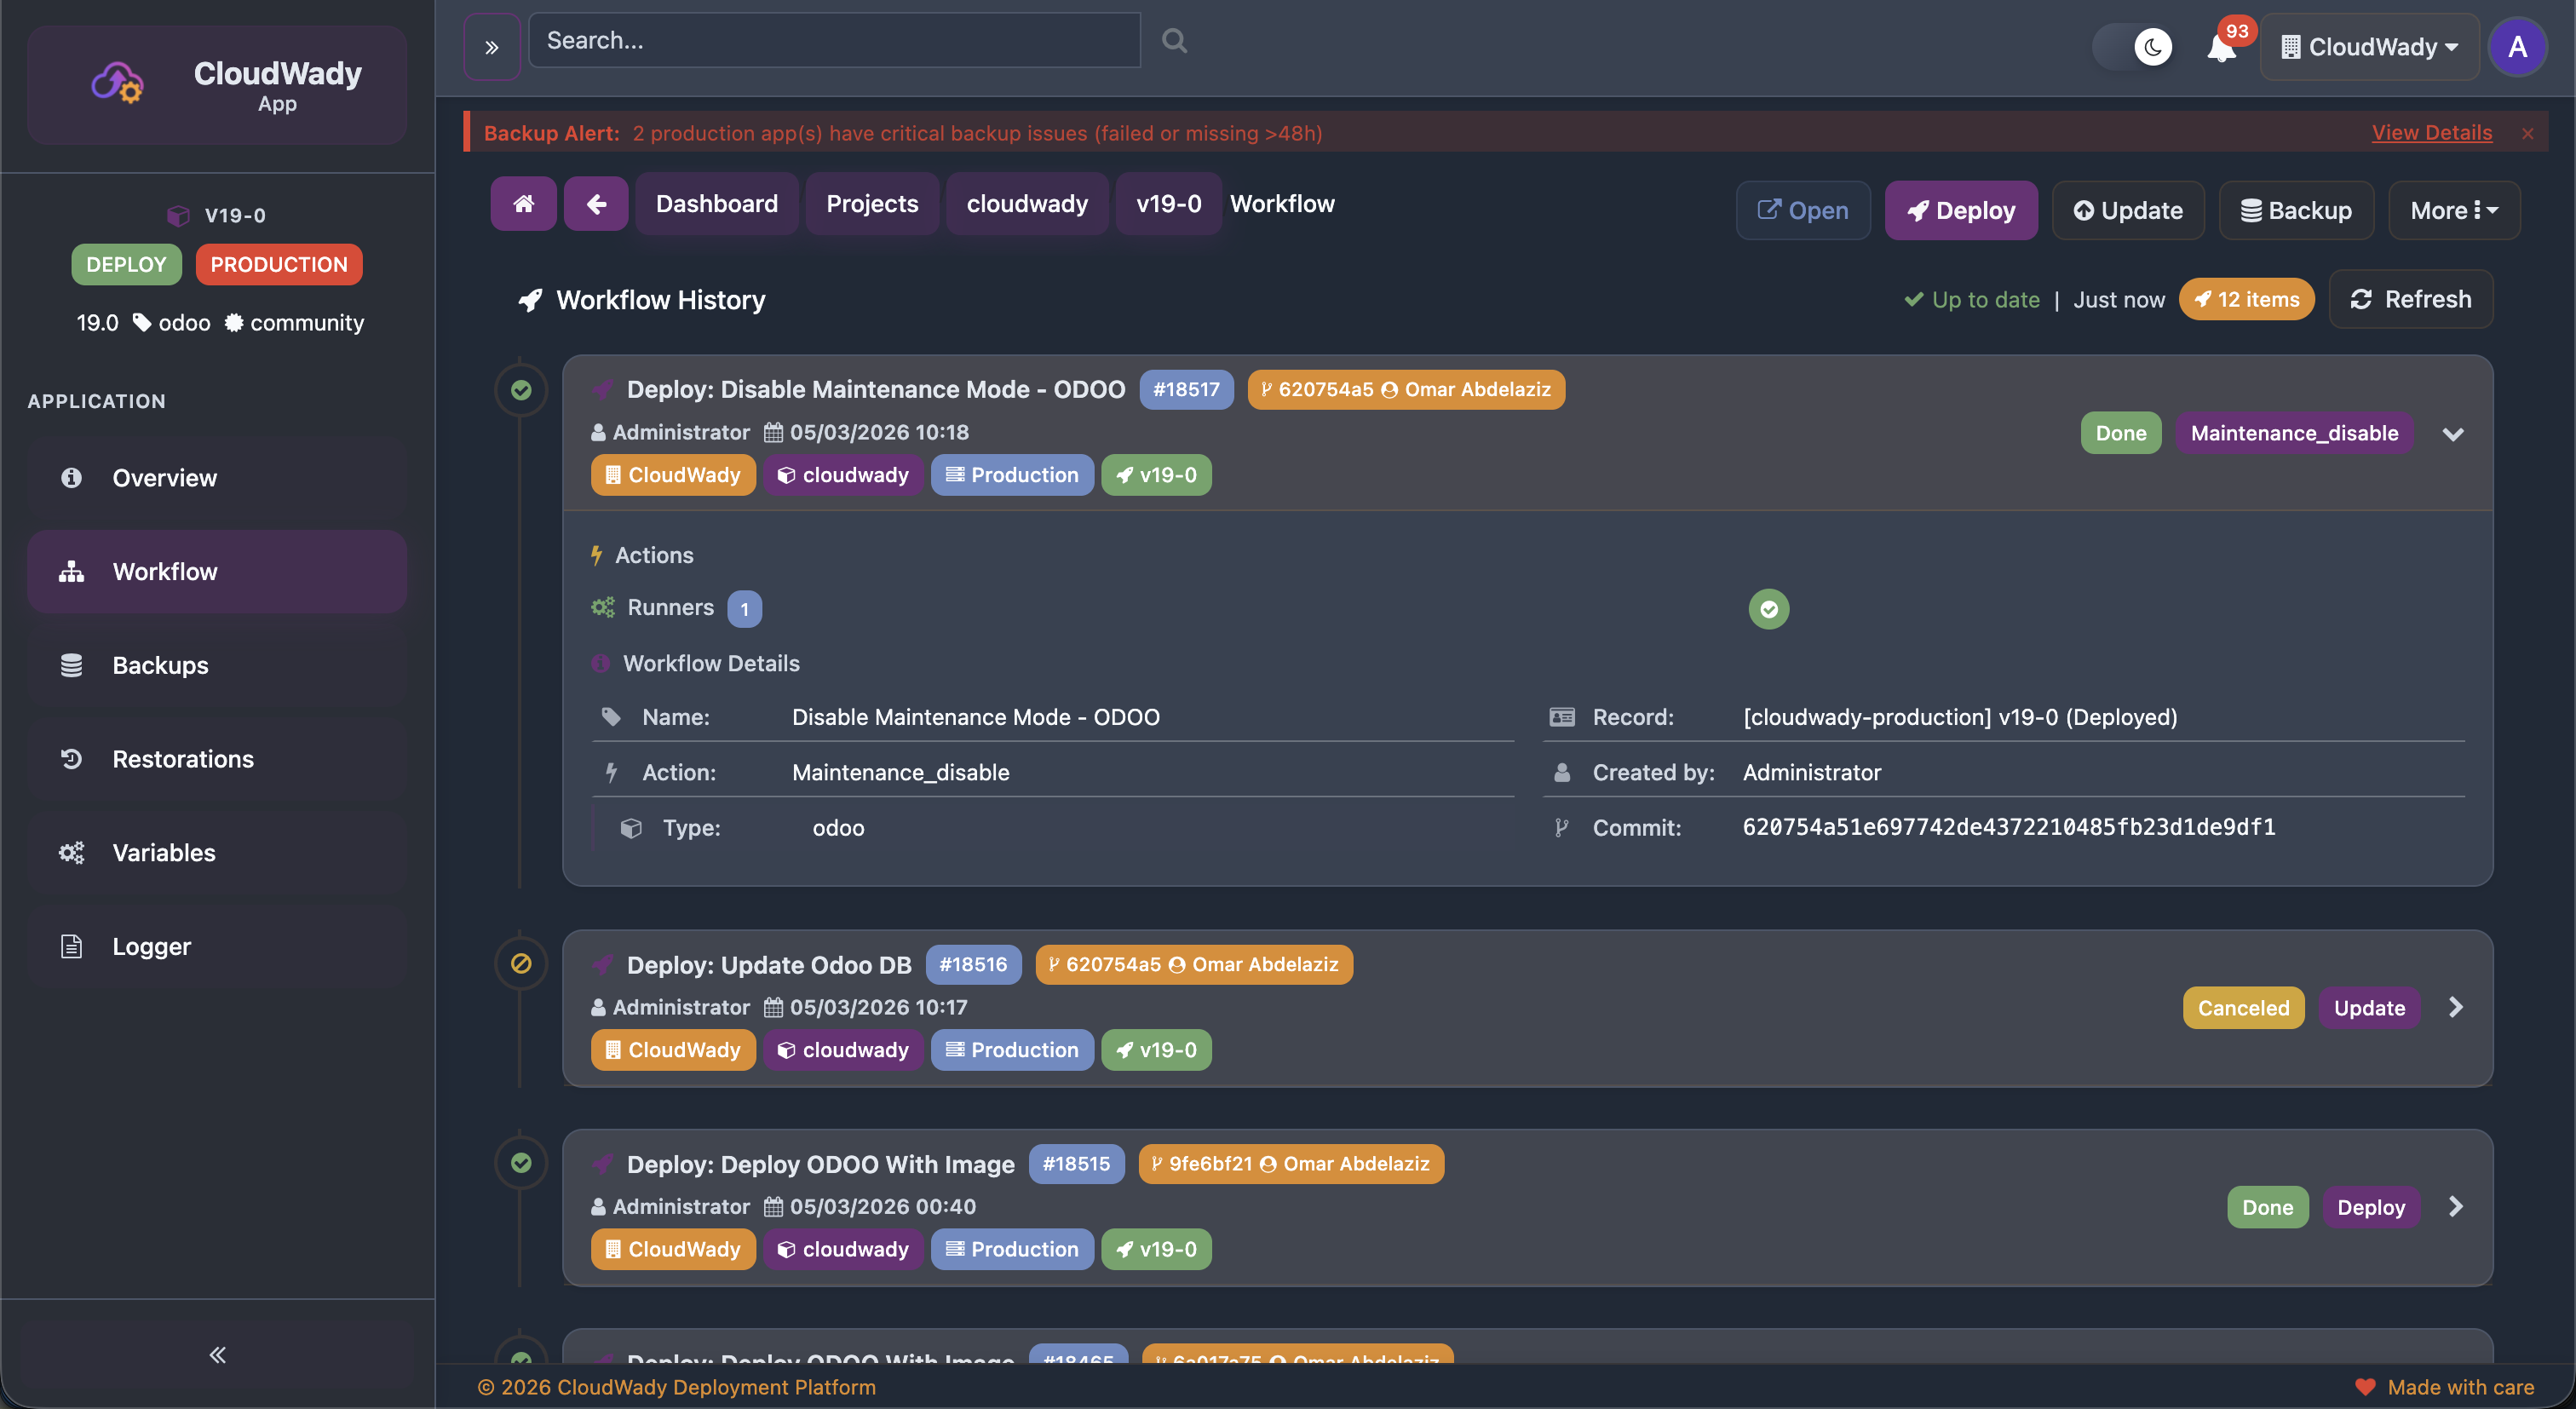
Workflow History
Each workflow entry displays:
- Workflow name: The operation type (Deploy, Update, Backup, etc.).
- Status badge: Color-coded state (Pending, Executing, Completed, Failed).
- Timestamp: When the workflow was triggered and completed.
- User: Who initiated the workflow.
- Expandable details: Click to view full Ansible output logs.
How Deployments Work
- Trigger: Click Deploy, Update, or another action button.
- Queue: A workflow job is created and queued for processing.
- Execution: InfraRelay picks up the job and runs Ansible playbooks on the target server.
- Progress: Real-time output streams to the dashboard via WebSocket.
- Result: Job completes with success or failure status, with full logs stored for review.
Available Actions
| Action | Description | Access Level |
|---|---|---|
| Time filter | Filter workflow history by time range | All |
| Refresh | Reload workflow history | All |
| Status filter | Filter by execution status (Pending, Running, etc.) | All |
| Expand entry | View detailed Ansible output for a workflow run | All |
Backups & Restorations
CloudWady provides comprehensive backup and restoration capabilities including automated scheduling, cross-server support, and remote storage uploads.
Backup History
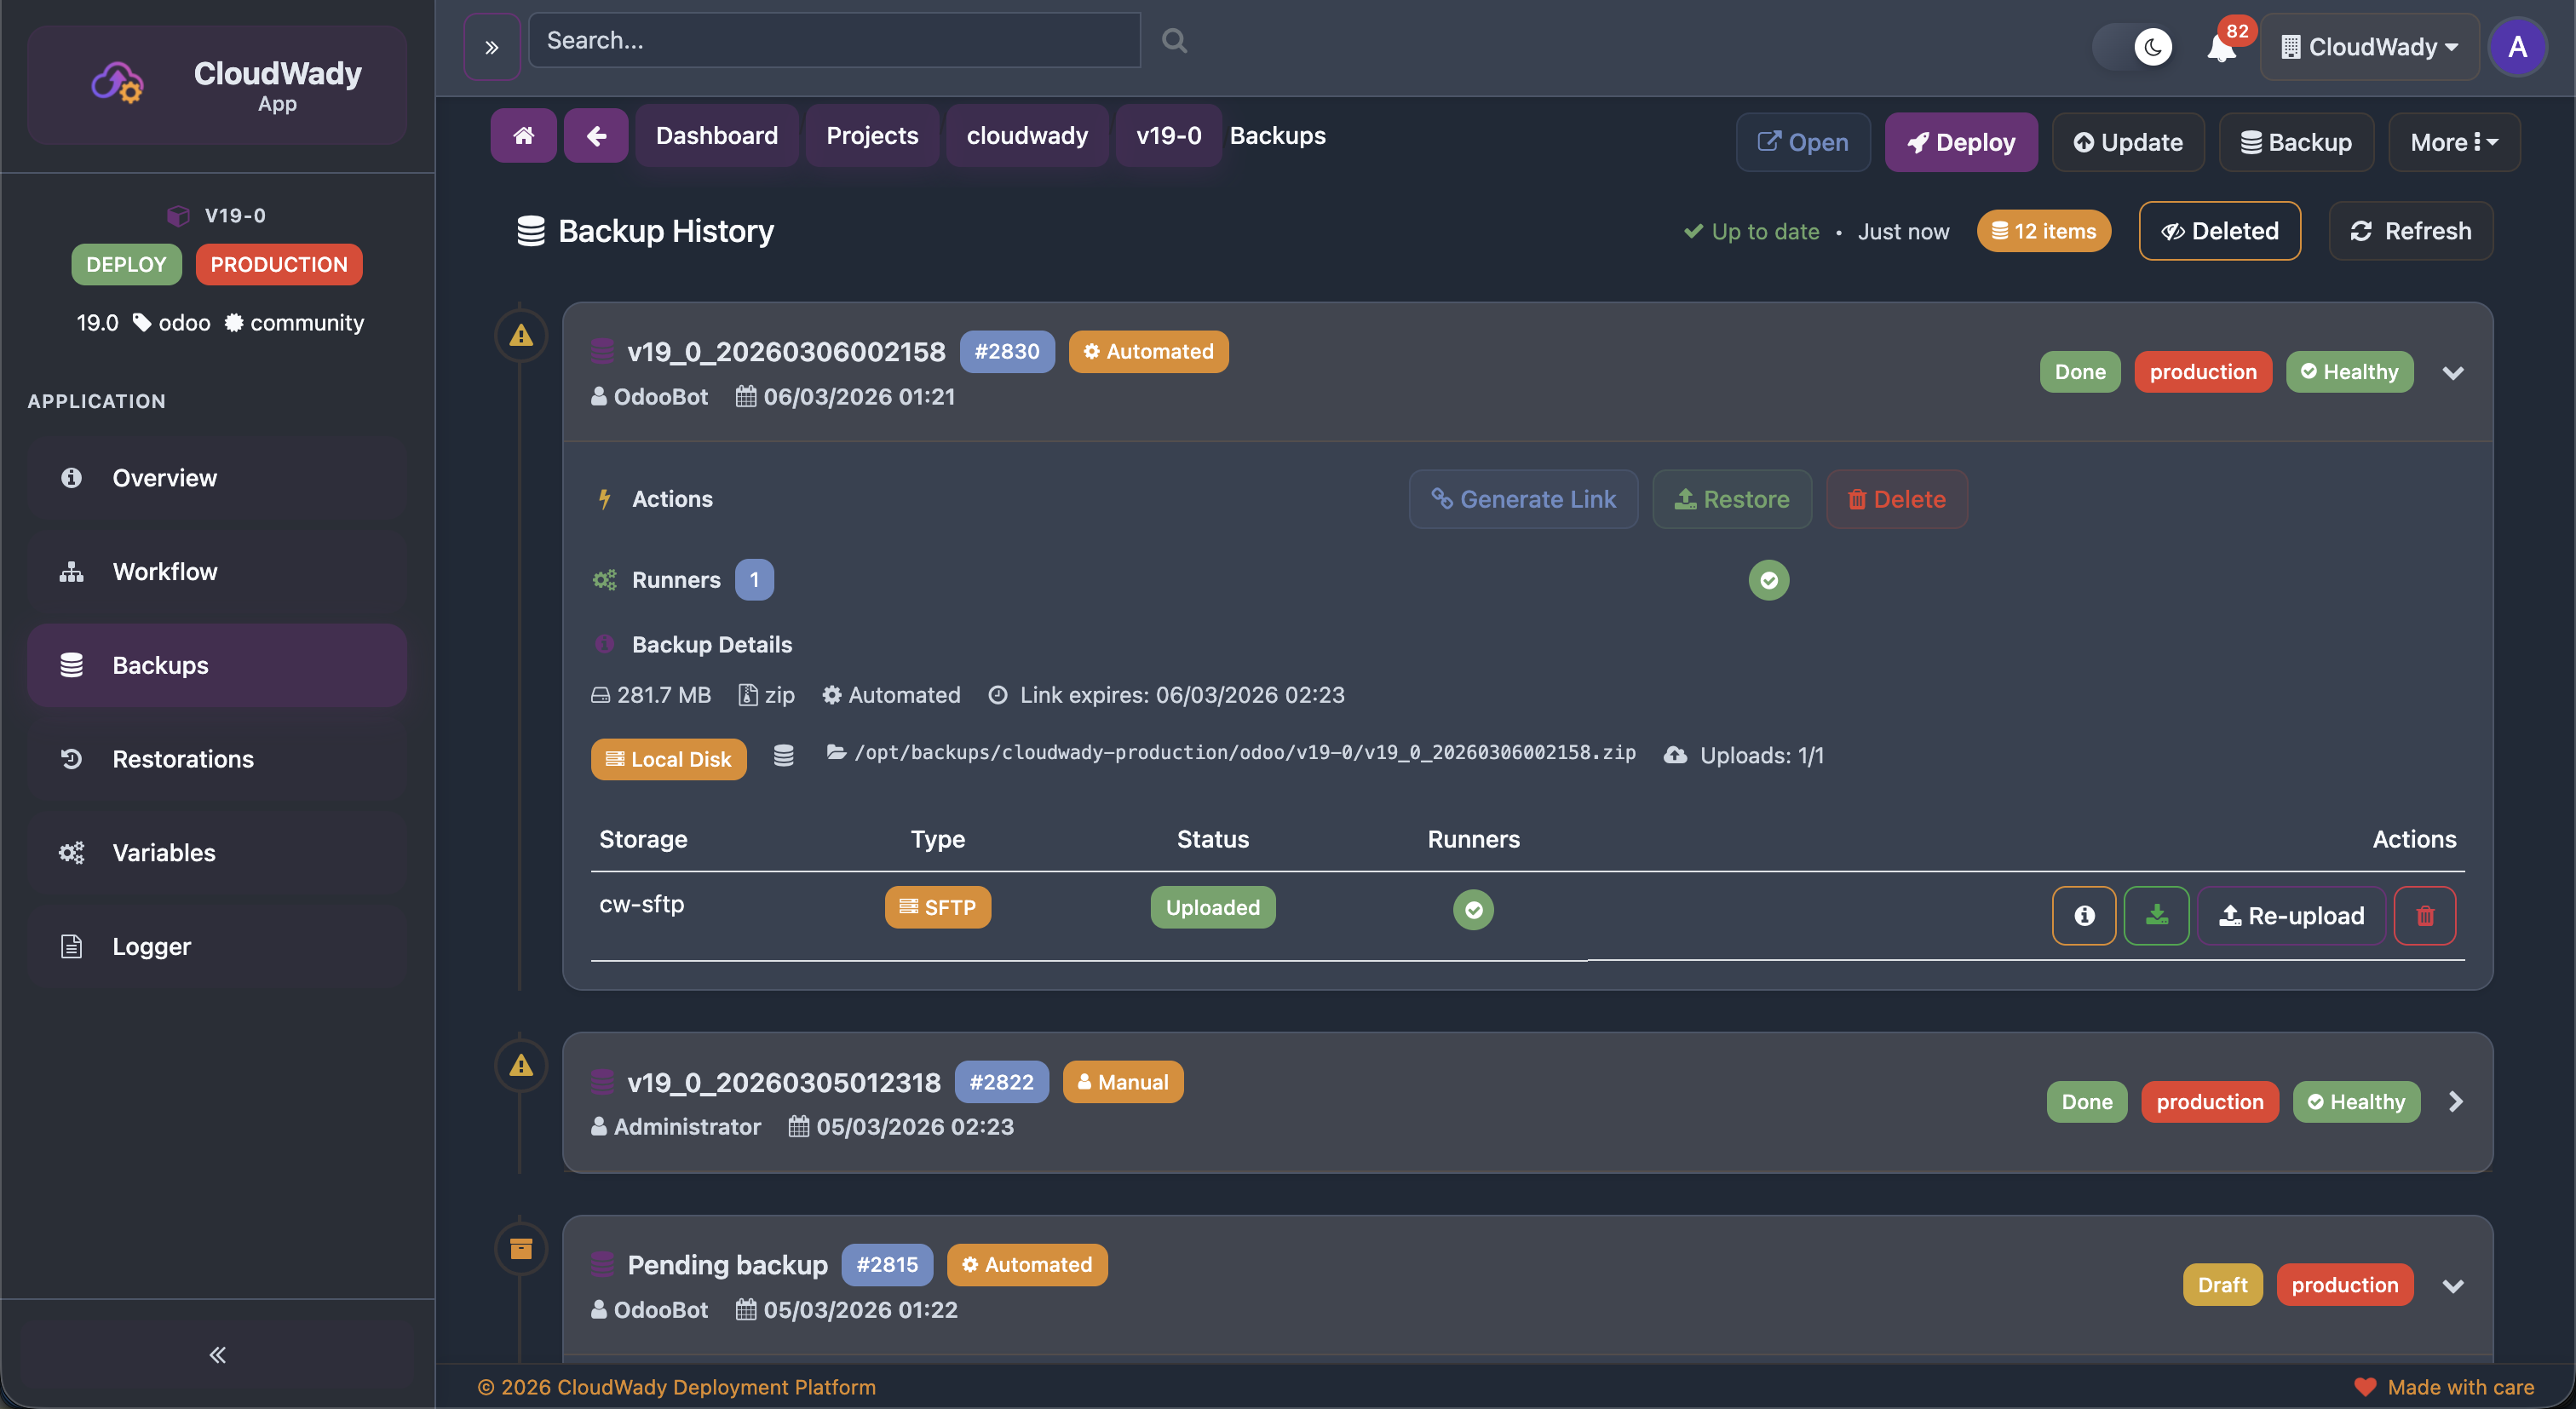
The Backups screen lists all backups for the application with:
- Backup ID: Unique identifier with sequence number.
- State badge: AUTOMATED (scheduled) or MANUAL (on-demand).
- Timestamp: When the backup was created.
- Status: Color-coded success, processing, or failed.
- Storage info: Storage box name, type (SFTP/Storage Box), upload status.
- Runners: Associated Ansible runner count.
Backup Actions
Actions are state-dependent — different buttons appear based on the backup's current workflow state:
| Action | Description | Condition | Access Level |
|---|---|---|---|
| Start | Begin backup execution | workflow_state is draft | Developer+ |
| Retry | Retry failed backup | workflow_state is error/canceled | Developer+ |
| Cancel | Cancel running/pending backup | workflow_state is running/draft | Developer+ |
| Download | Download backup file | Download link is available | Developer+ |
| Generate Link | Create a time-limited download link | No download link exists yet | Developer+ |
| Restore | Initiate restoration from this backup | Backup is completed | Developer+ |
| Delete | Remove the backup record | Not currently running | Admin |
| Deleted toggle | Show or hide deleted backups | Always | All |
Storage Upload Actions
Each backup can have storage uploads (expandable). Per-upload actions:
| Action | Description |
|---|---|
| Info | View storage upload details (type, status, runner) |
| Download from Storage | Download backup from remote storage |
| Upload / Retry Upload | Upload backup to storage or retry failed upload |
| Delete from Storage | Remove backup from remote storage |
Restorations
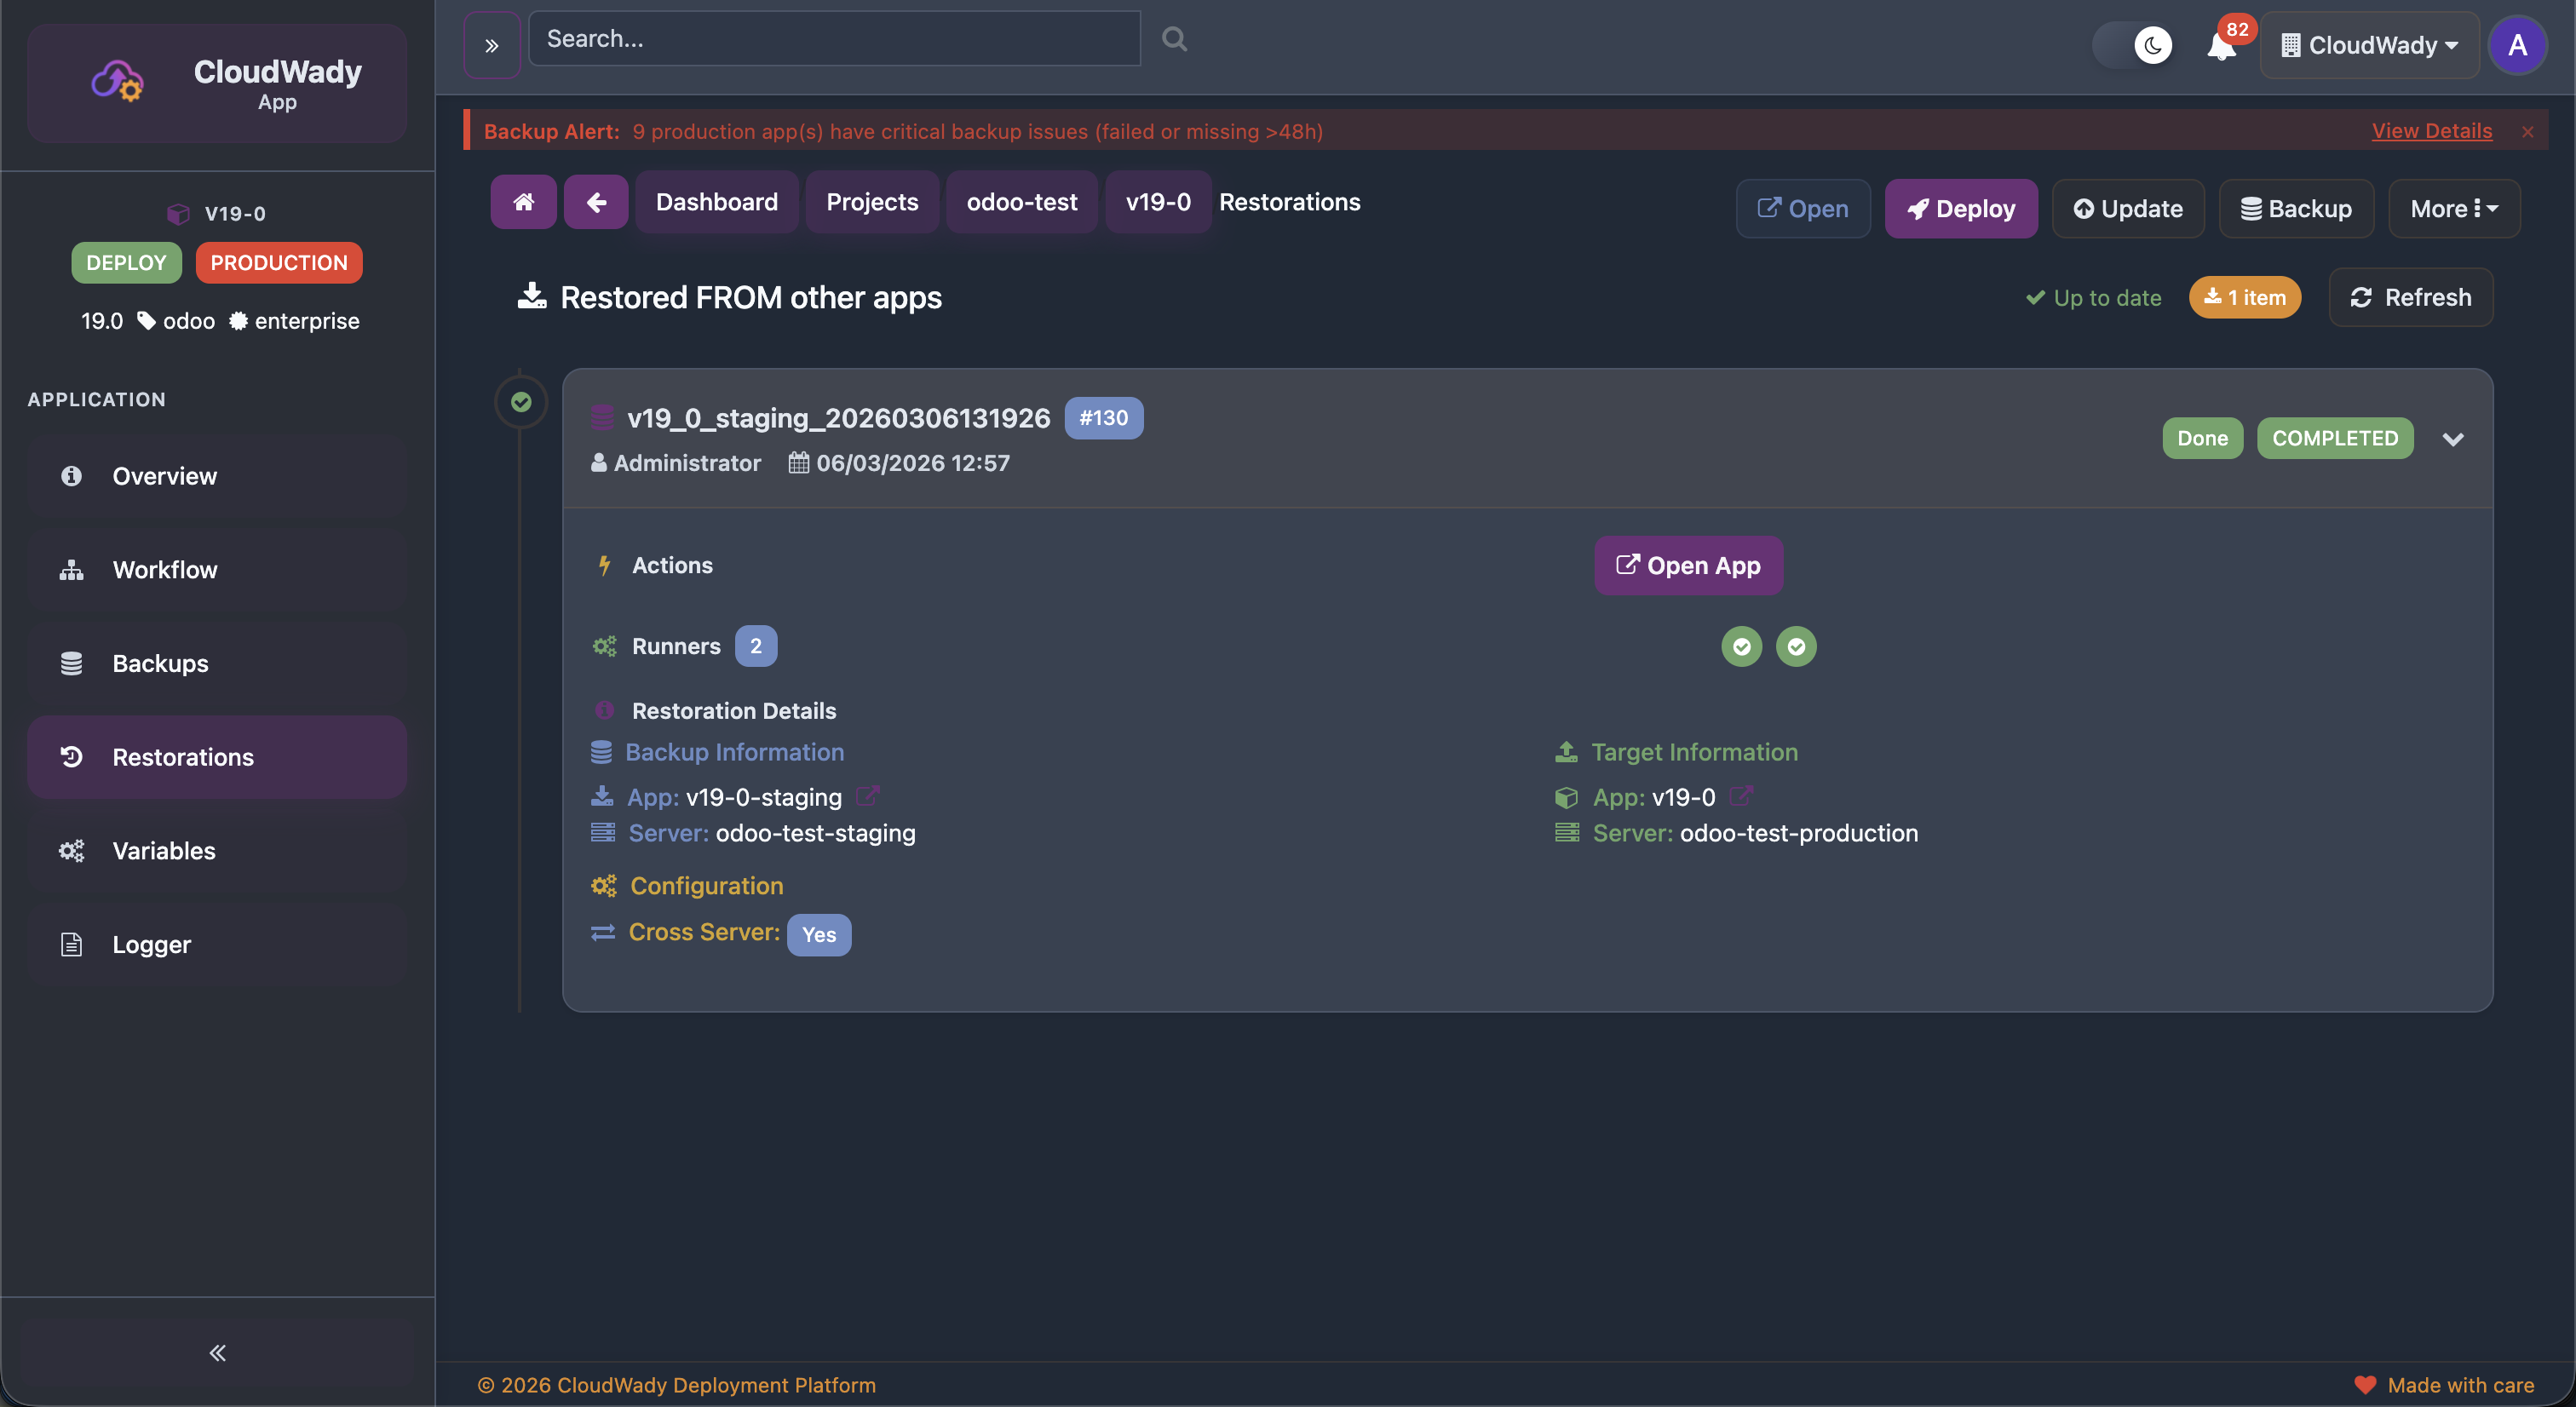
The Restorations screen shows two sections: Target Restorations (restored FROM other apps to this app) and Source Restorations (restored TO other apps from this app). Each restoration displays:
- Source app and server with navigation link.
- Target app and server with navigation link.
- Configuration badges: Reset Admin (Yes/No), Neutralize DB (Yes/No), Cross Server (Yes/No).
Restoration Actions
Actions are state-dependent:
| Action | Description | Condition | Access Level |
|---|---|---|---|
| Start | Begin restoration | State not in done/error/running | Developer+ |
| Retry | Retry failed restoration | State is error/canceled | Developer+ |
| Cancel | Cancel running/pending restoration | State is running/draft | Developer+ |
| Open App | Navigate to the restored application | Target app URL exists | Viewer+ |
Server Management
Servers are the infrastructure backbone of your deployments. CloudWady supports automated provisioning and ongoing management.
Server List
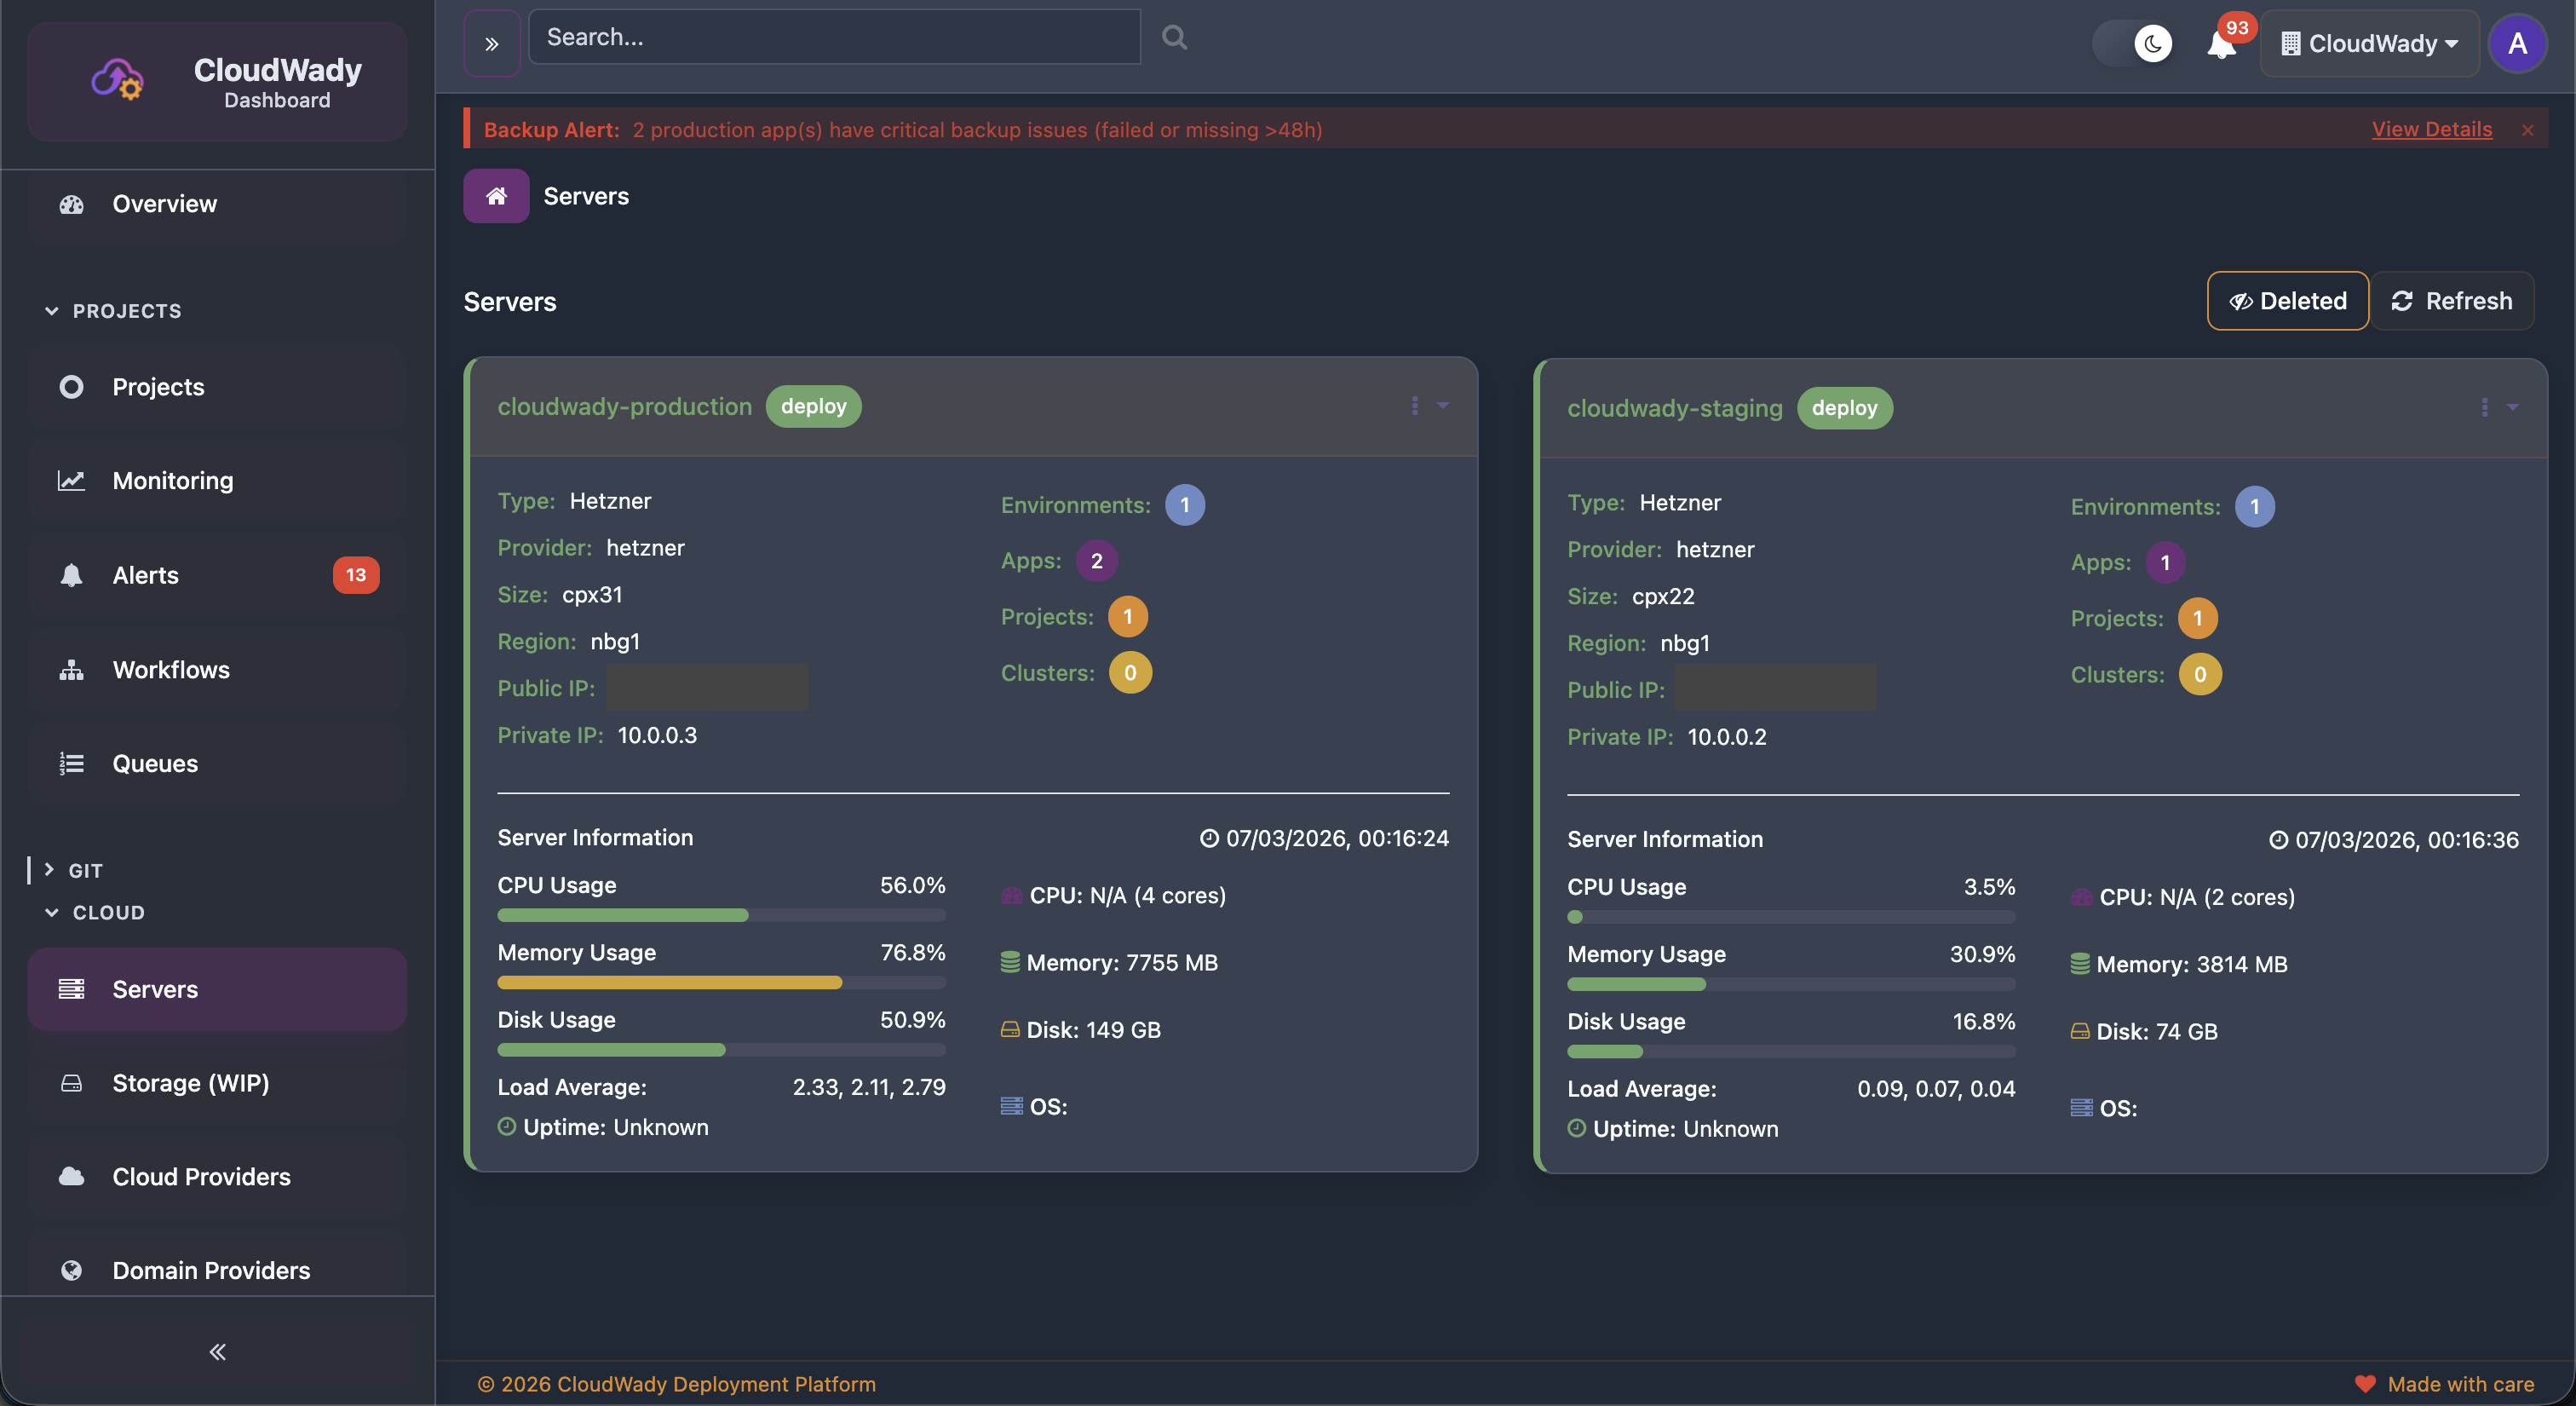
The Servers screen displays all servers as cards showing: server name, deploy state badge, provider (Hetzner/DigitalOcean), environment count, app count, project count, cluster count, and public/private IPs. Below each card, real-time server information shows CPU usage with core count, memory usage, disk usage with capacity, load average, and uptime.
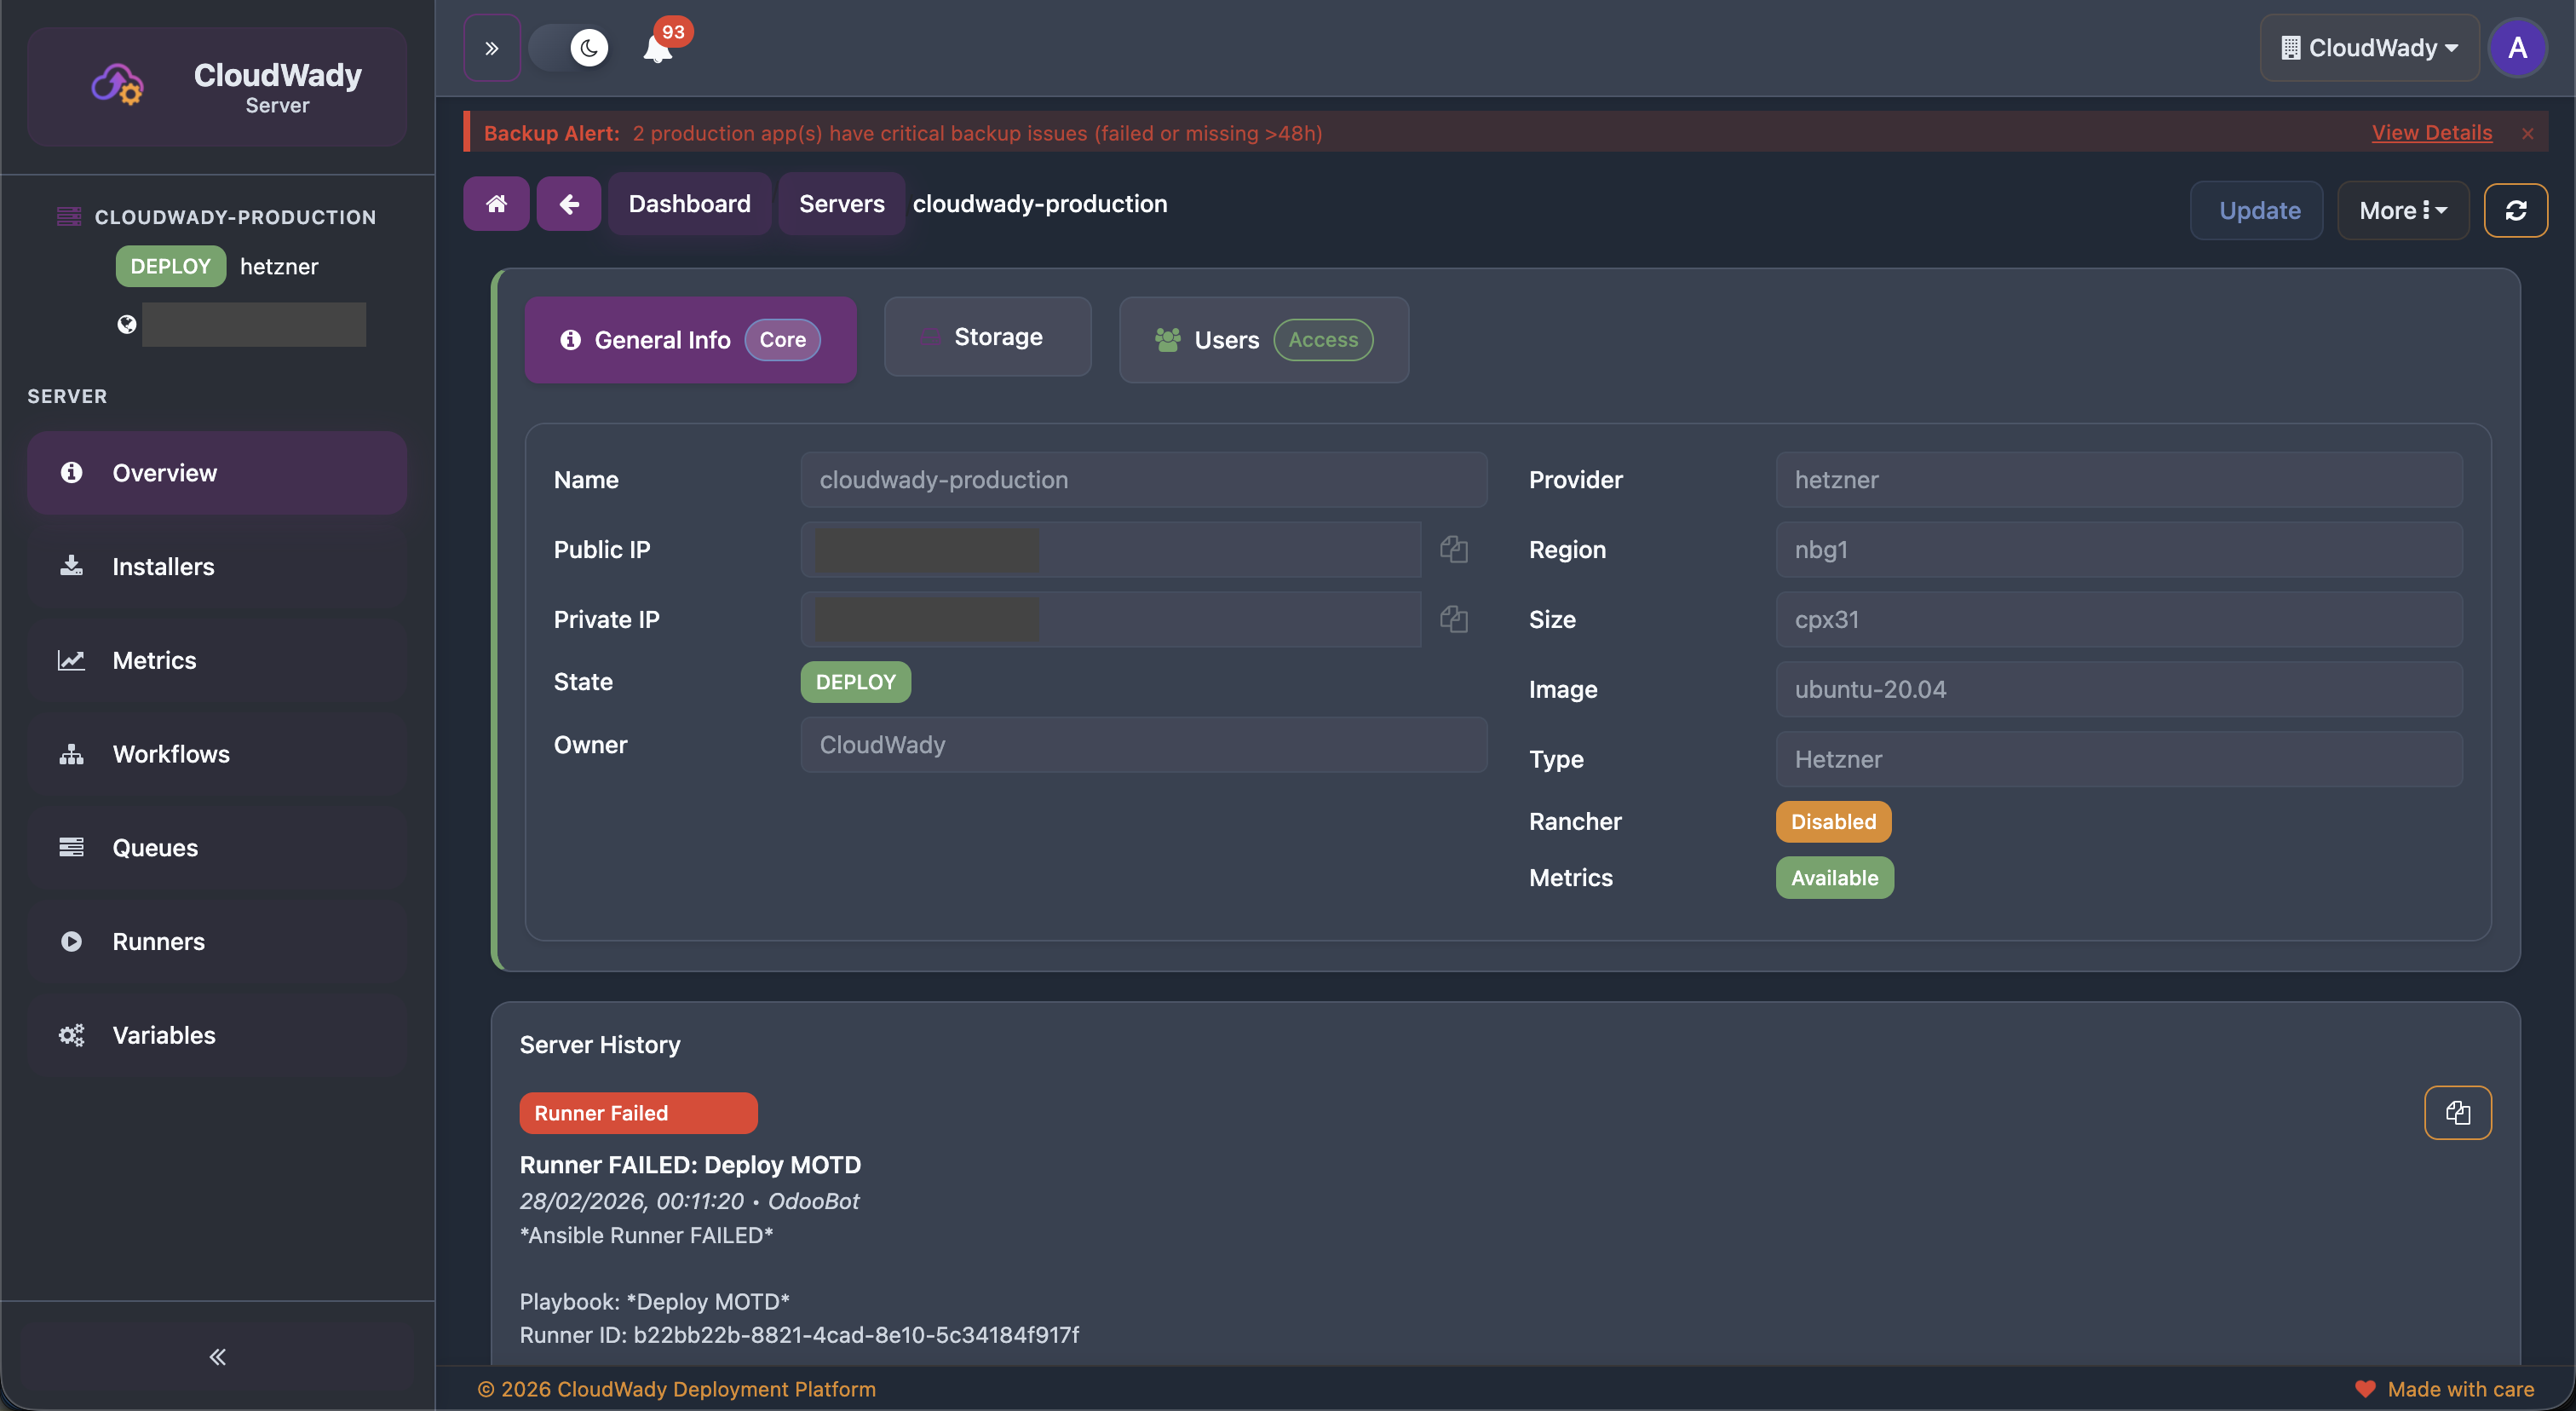
General Info Tab
Server Sidebar Navigation
| Menu Item | Icon | Description |
|---|---|---|
| Overview | fa-info-circle | Server info with sub-tabs: General Info, Storage, Users |
| Installers | fa-download | Installed services management (Docker, Nginx, InfraRelay, etc.) |
| Metrics | fa-line-chart | Real-time CPU, RAM, disk, network metrics (disabled if server not deployed) |
| Workflows | fa-sitemap | Server-level Ansible workflow history |
| Queues | fa-tasks | Server job queue |
| Runners | fa-play-circle | Active Ansible runners and their status |
| Variables | fa-cogs | Server configuration variables (requires server update permission) |
Overview Tabs
| Tab | Badge | Description |
|---|---|---|
| General Info | Core | Name, Public IP, Private IP, Provider, Region, Size, Image, Type, Metrics availability |
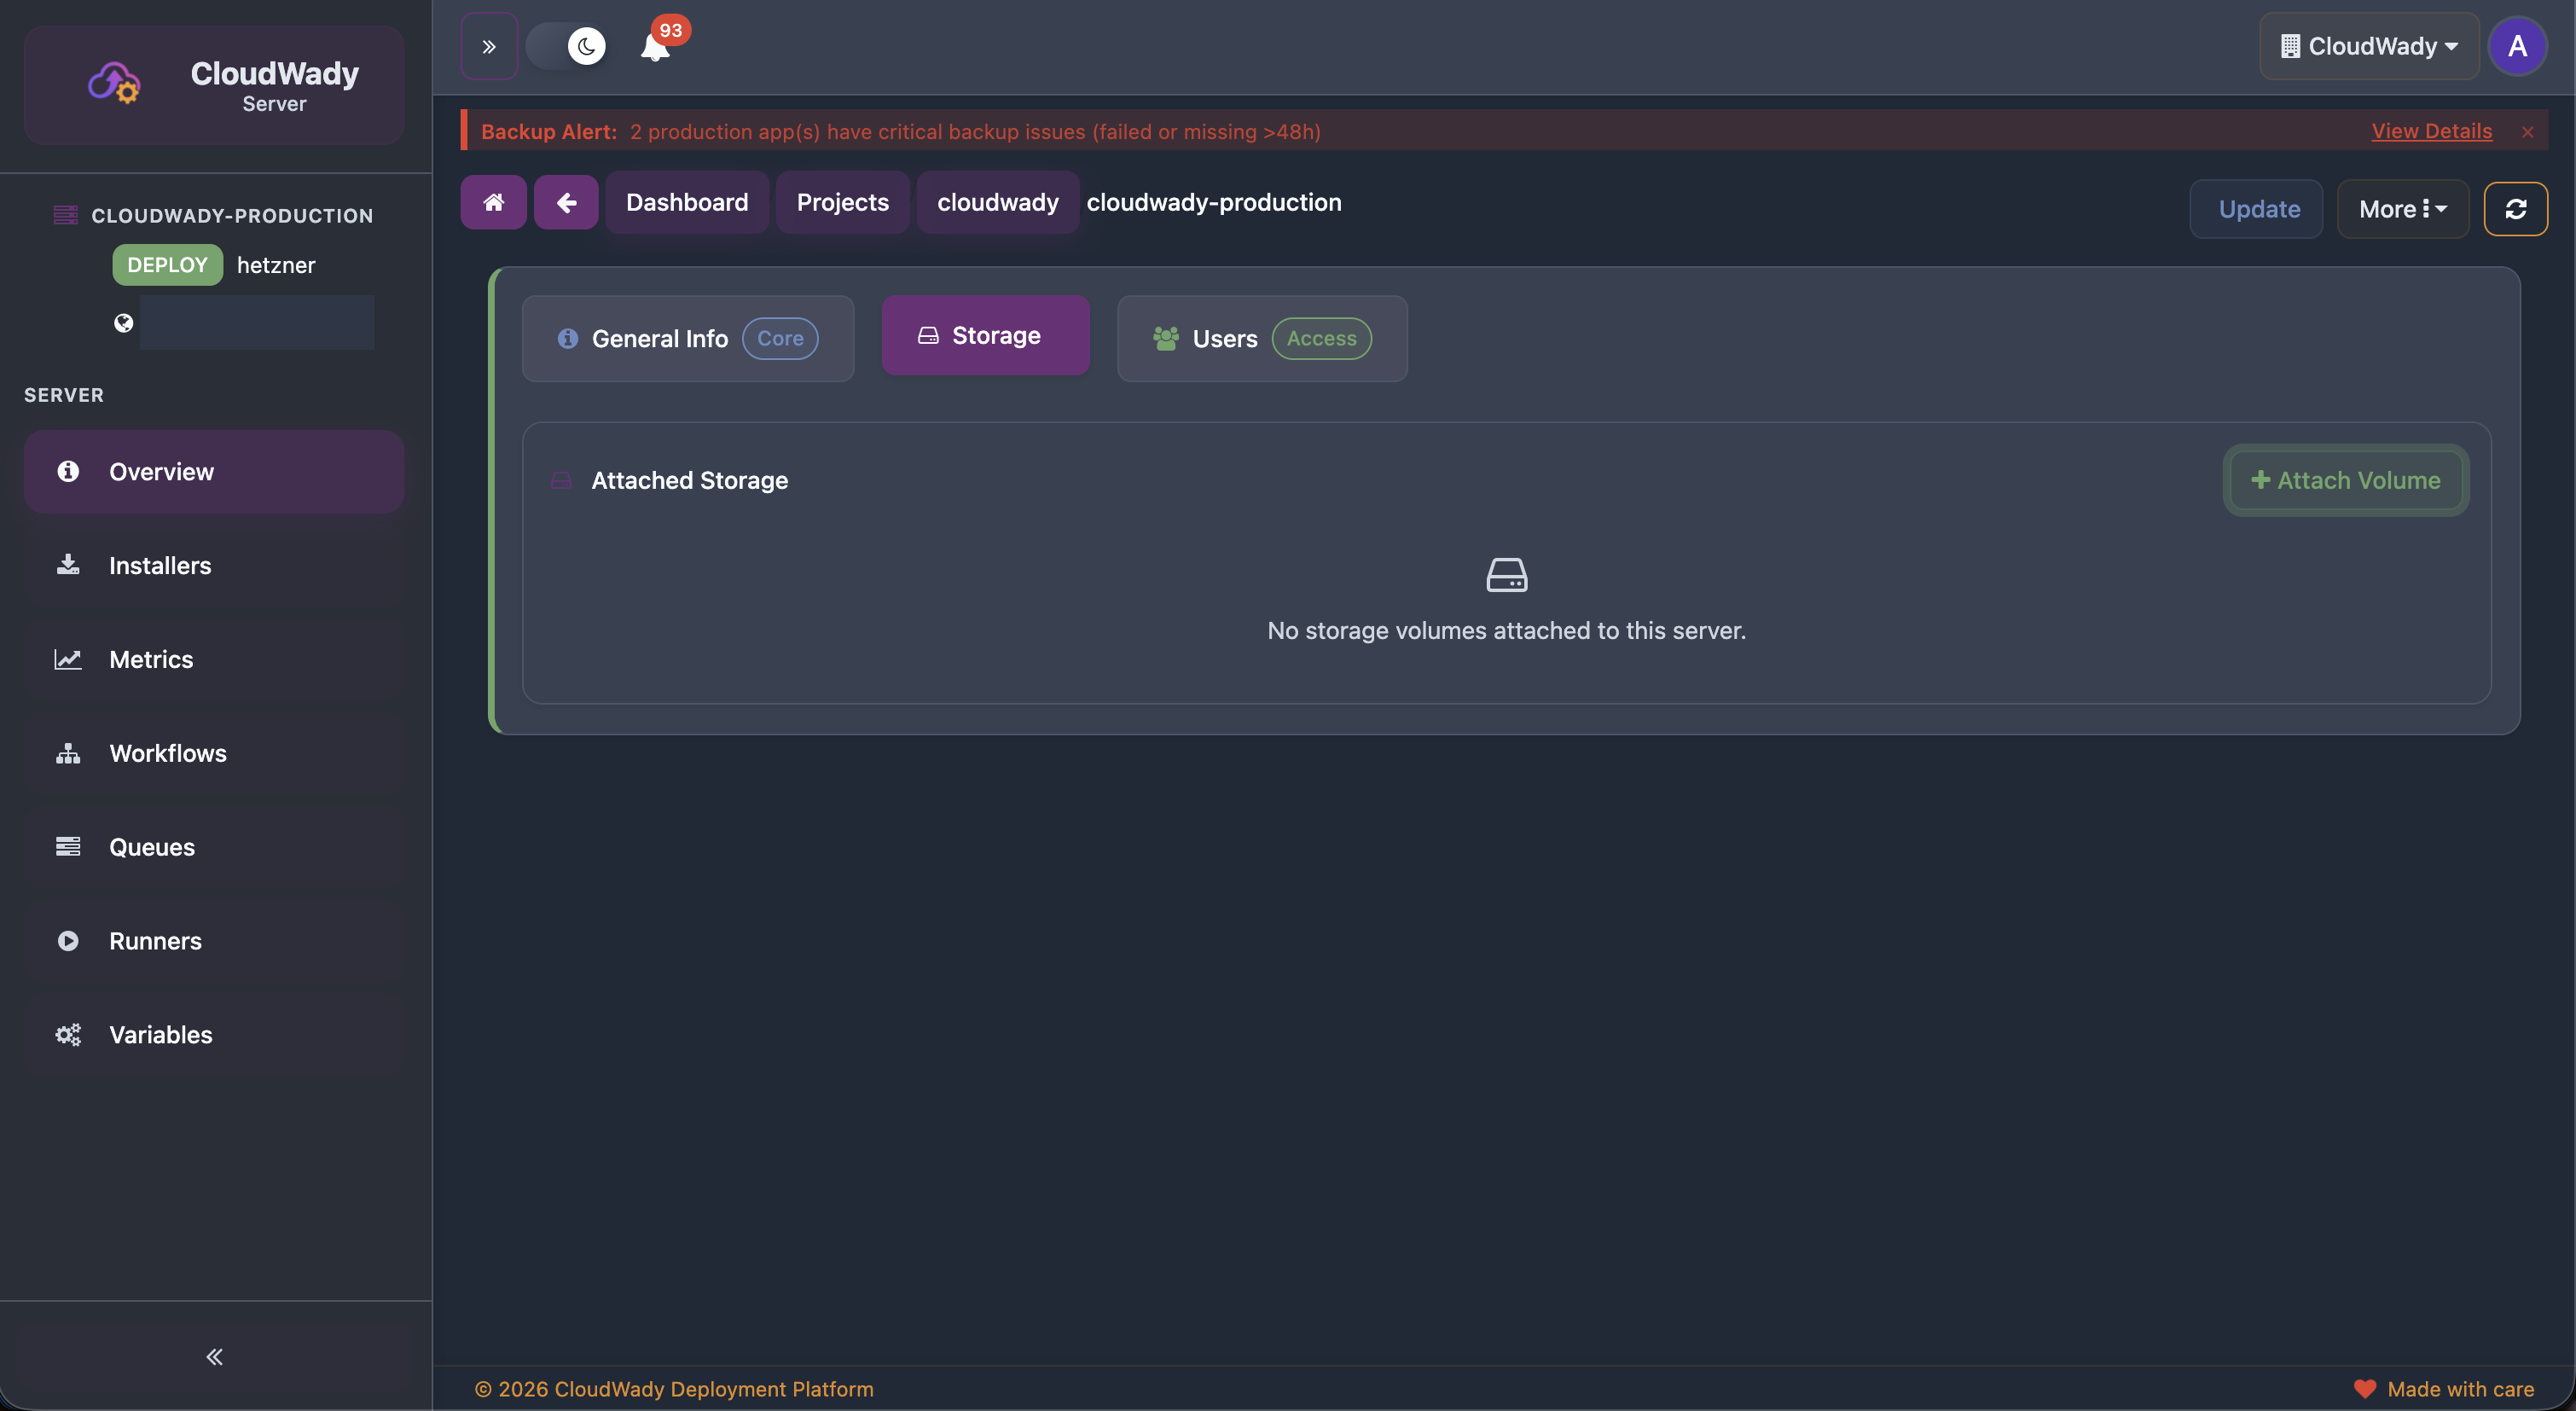
| Storage | Volume count | Attached storage volumes with attach/detach controls |
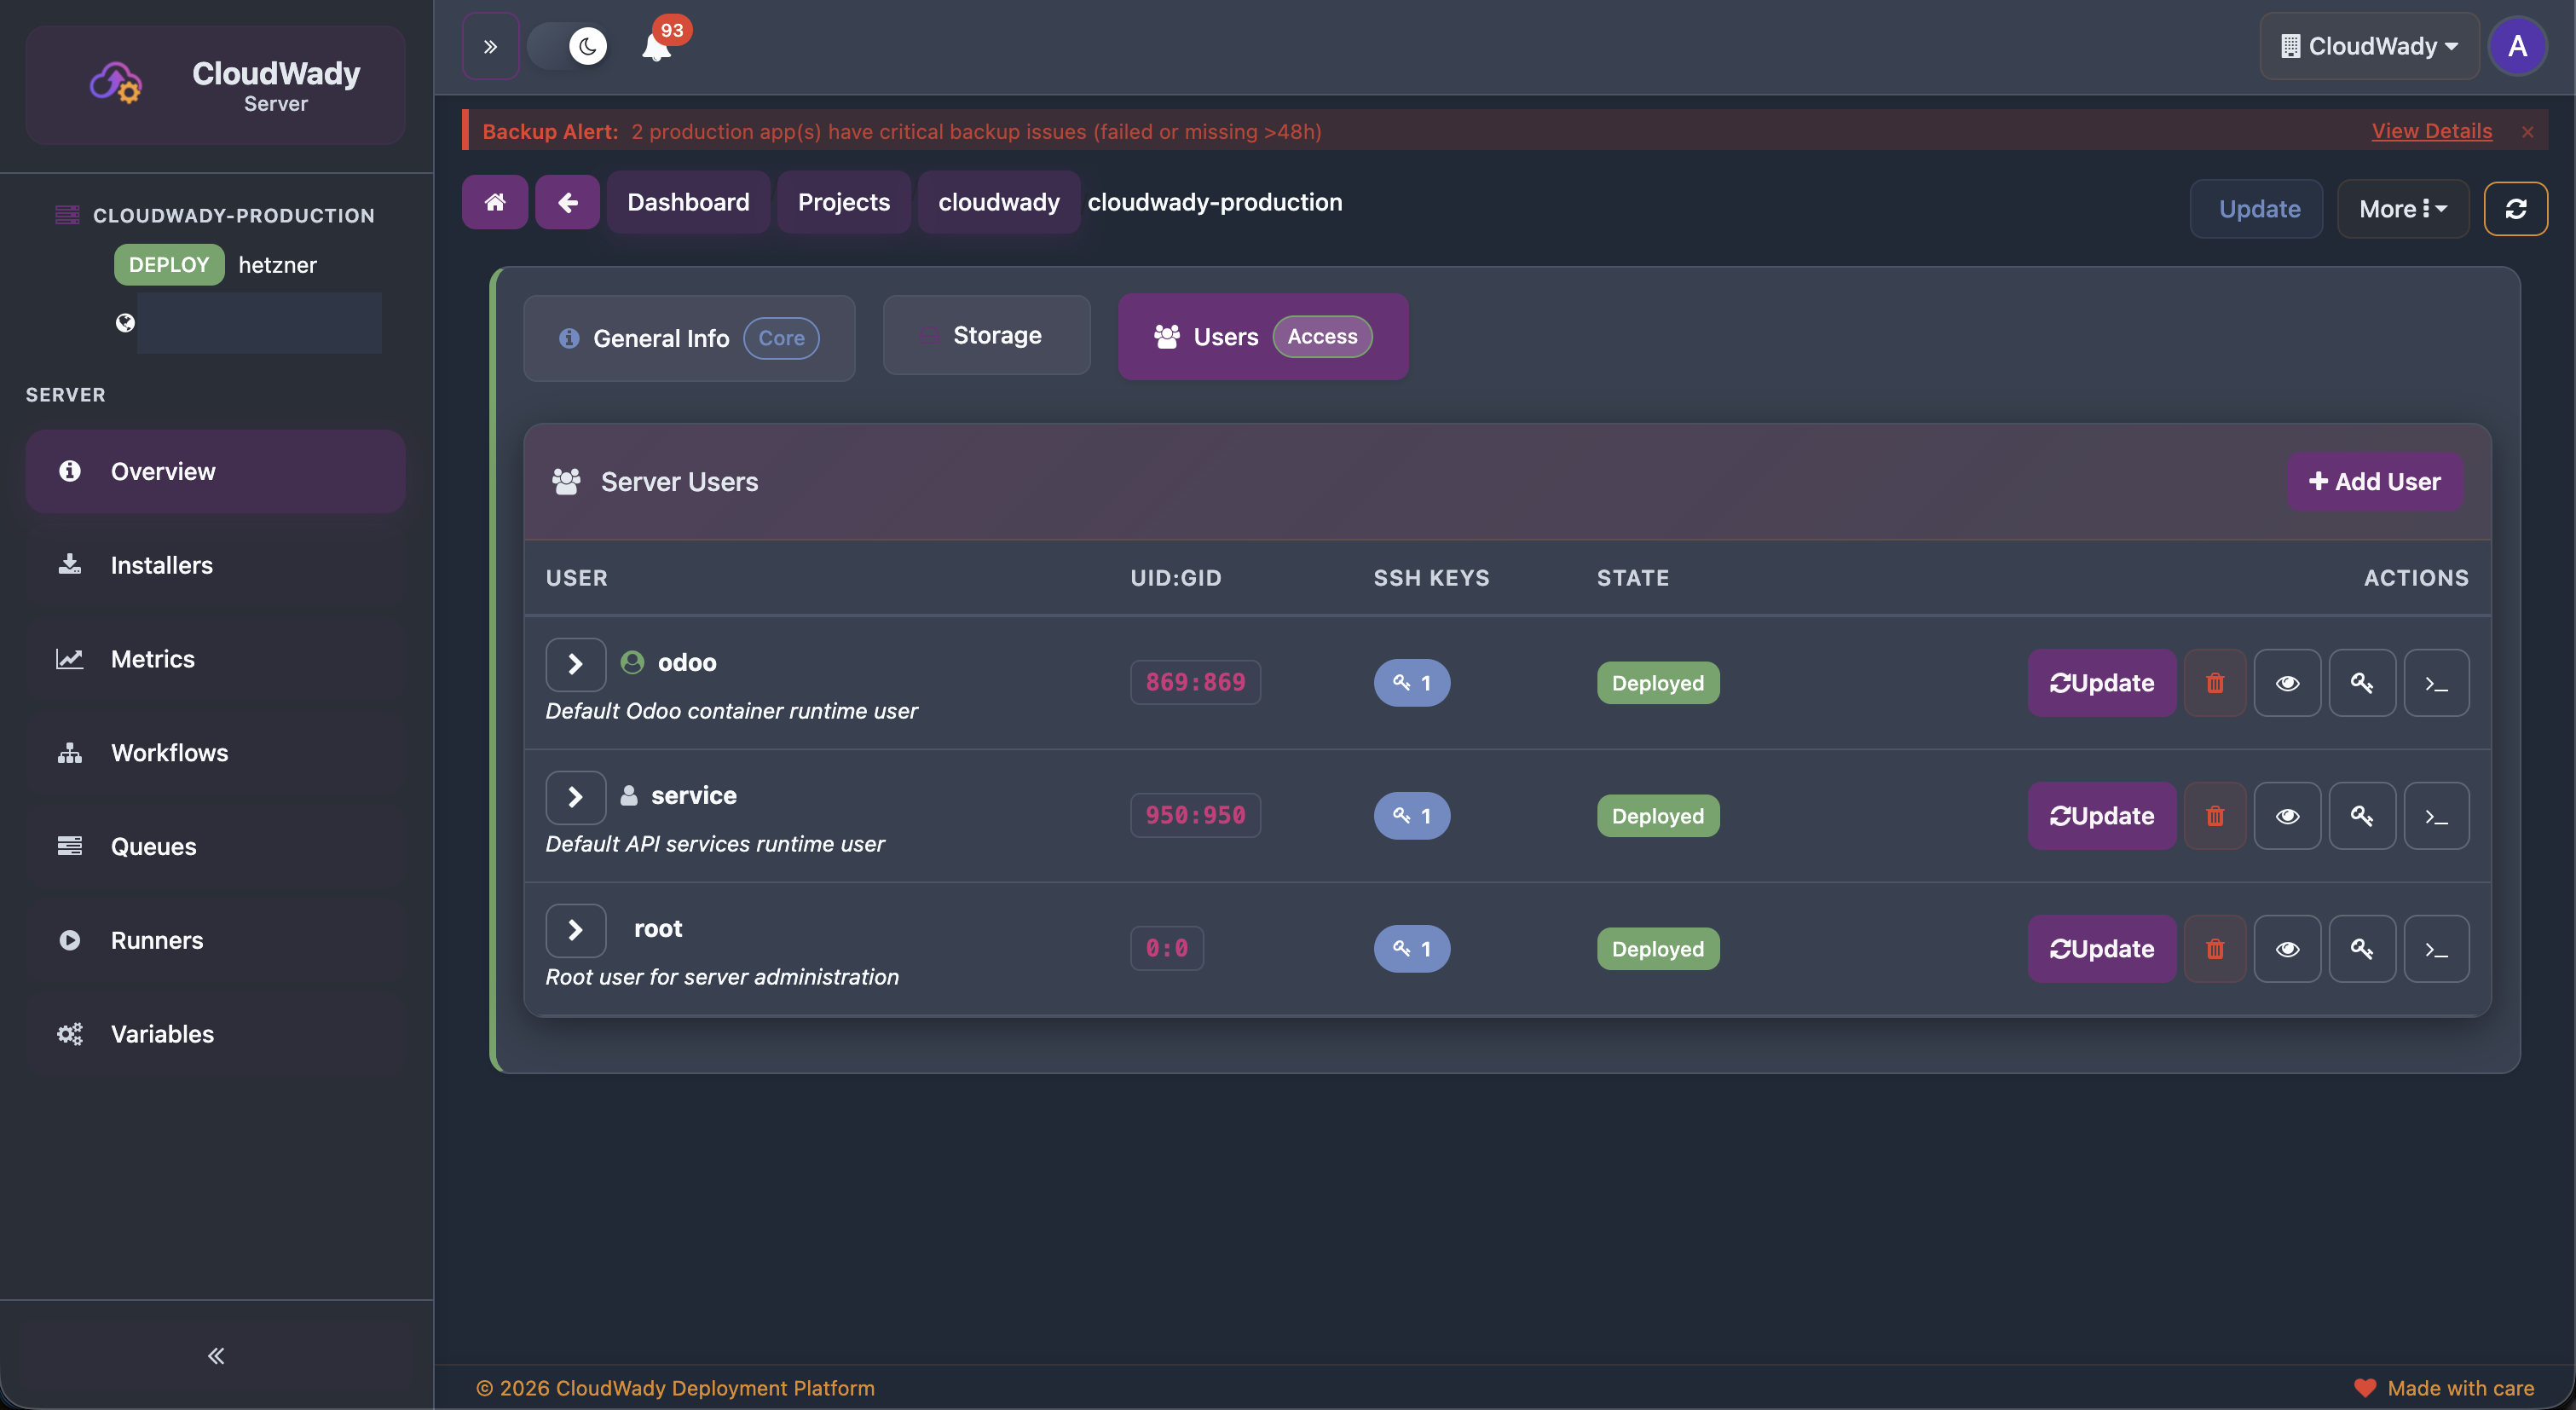
| Users | Access | Server users with SSH keys and terminal access |
Storage Tab
Users Tab
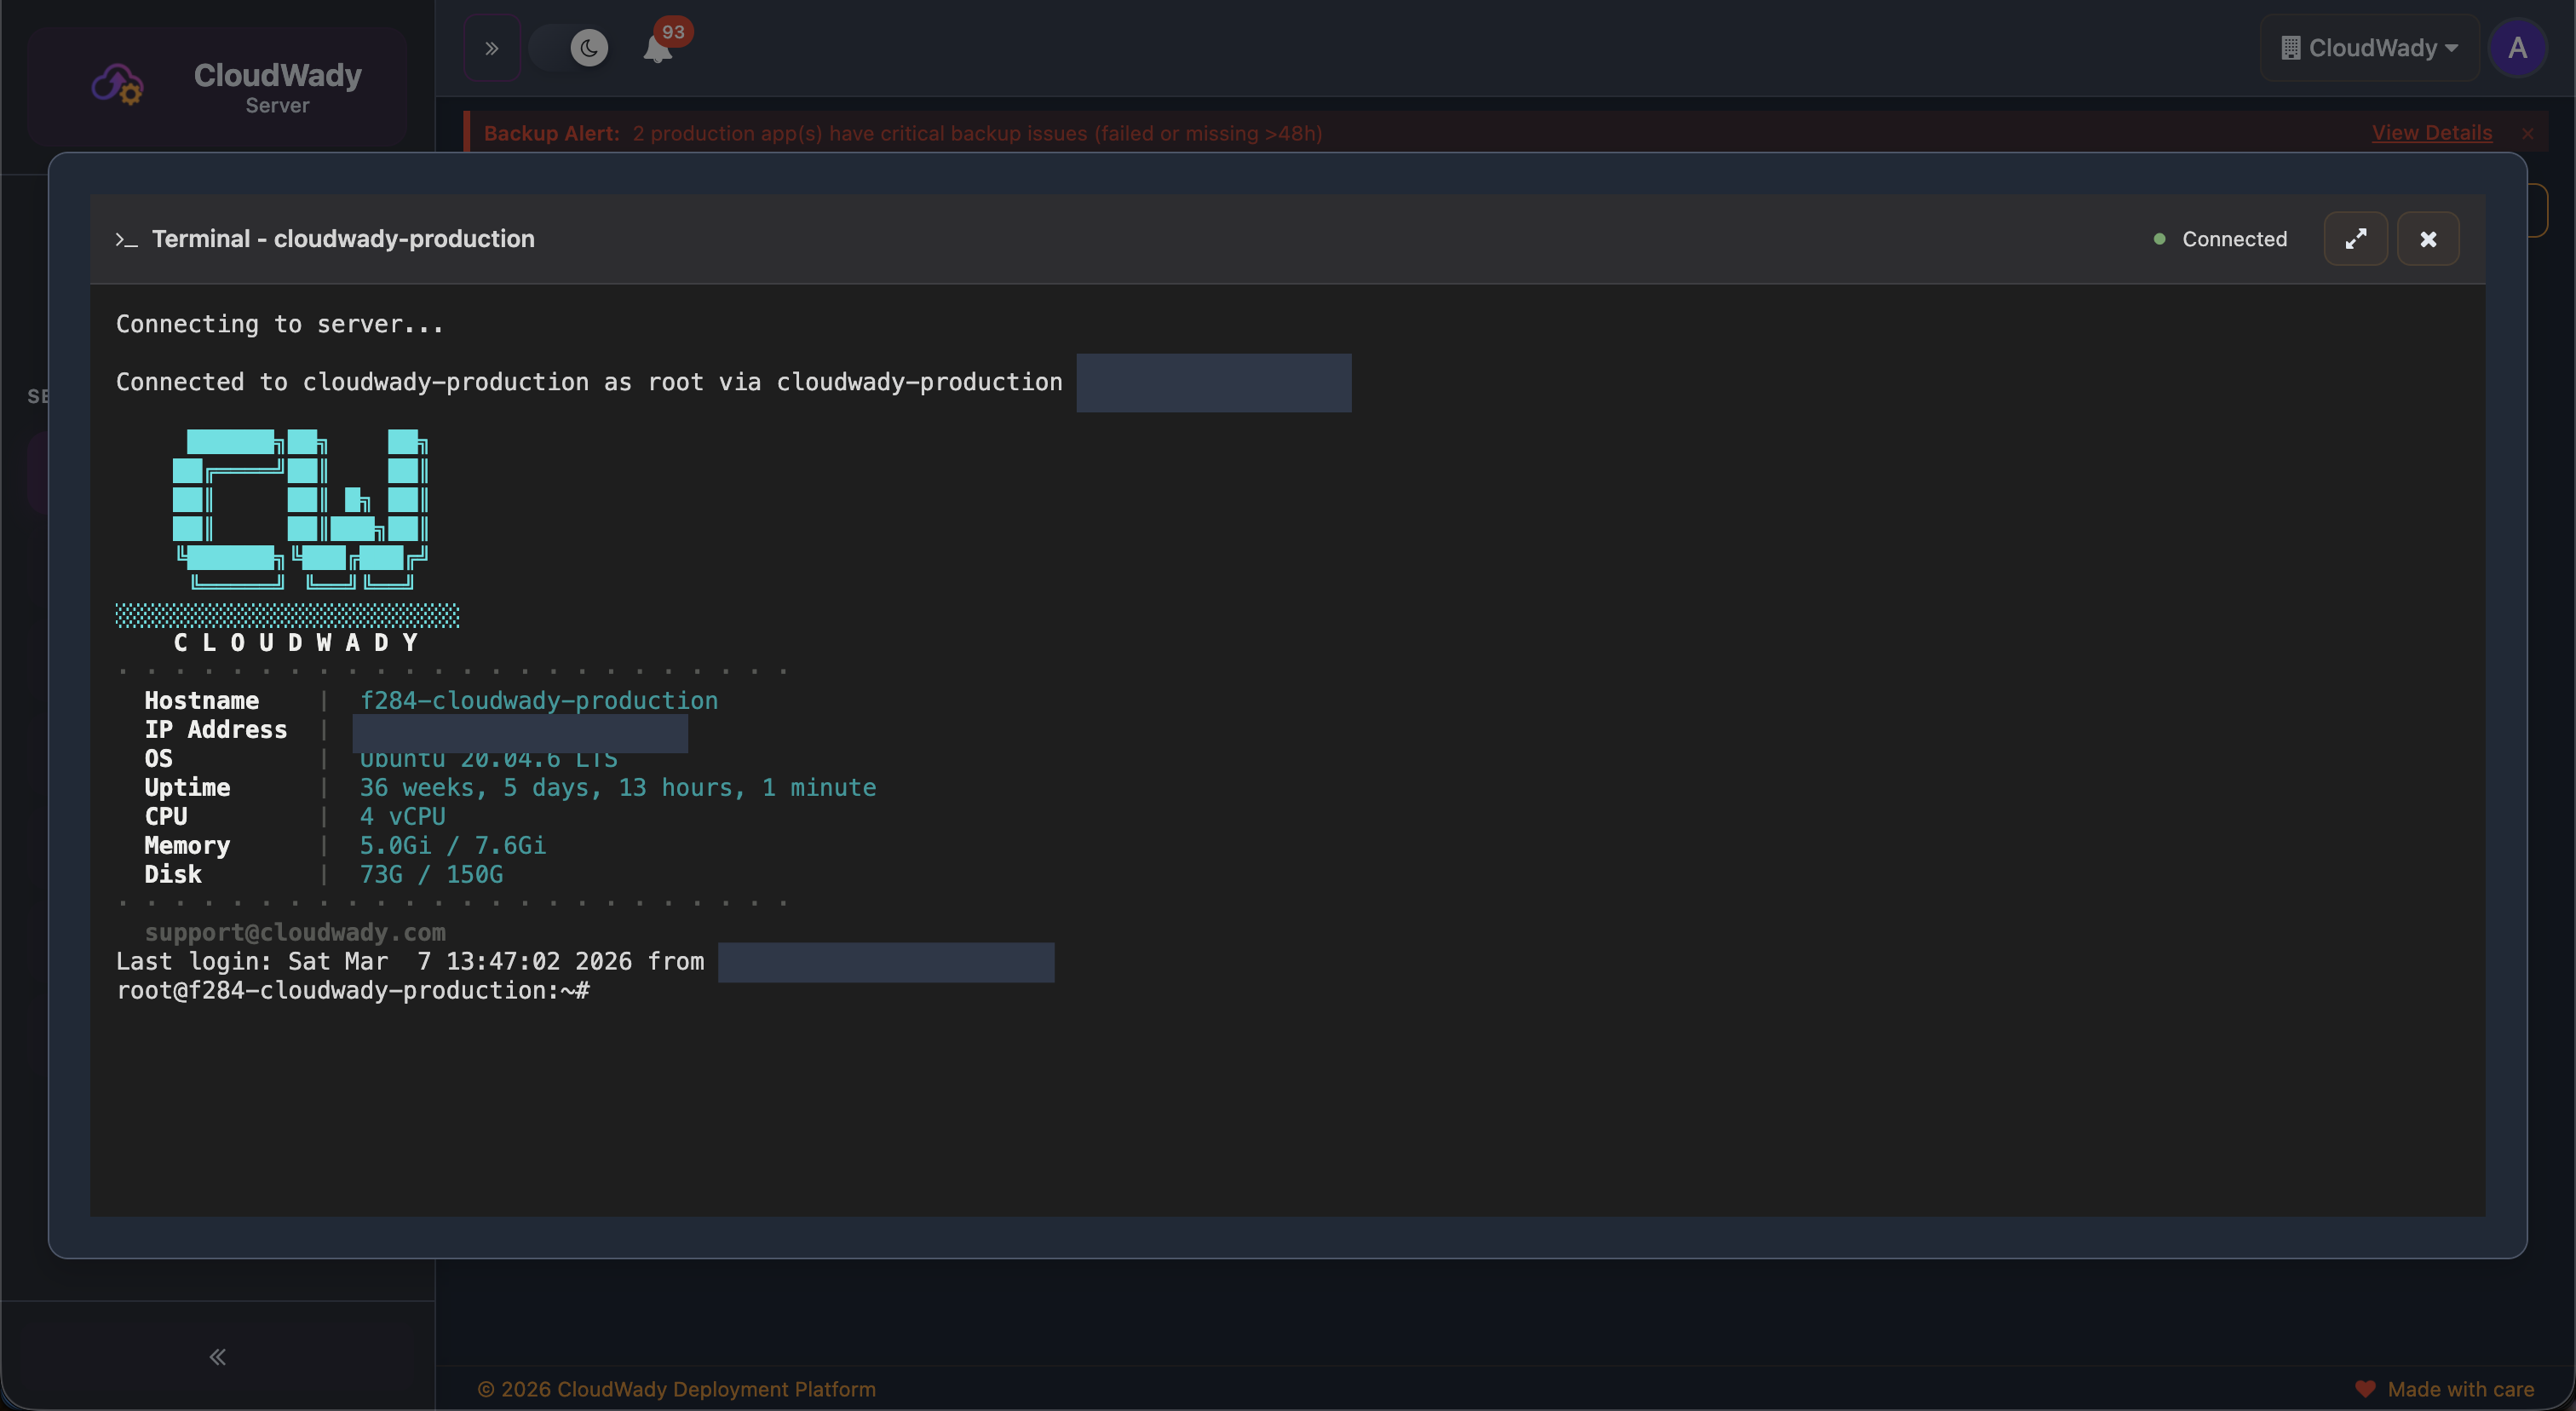
SSH Terminal
Server Actions
| Action | Description | Access Level |
|---|---|---|
| Update | Update server configuration and sync data | Maintainer |
| More+ | Additional server operations | Maintainer |
| Deleted / Refresh | Toggle deleted servers or reload server list | All |
Storage Tab Actions
| Action | Description | Access Level |
|---|---|---|
| Attach Volume | Attach a new storage volume to the server | Maintainer |
| Attach (per volume) | Attach a volume in draft/delete state | Maintainer |
| Detach (per volume) | Detach a deployed volume | Maintainer |
Users Tab Actions
| Action | Description | Access Level |
|---|---|---|
| Add User | Add a new server user | Maintainer |
| Deploy User | Deploy user to server | Maintainer |
| Update User | Update user configuration | Maintainer |
| Delete User | Delete server user | Maintainer |
| Unlink User | Unlink user without deleting | Maintainer |
| View Details | View user information | Viewer+ |
| View SSH Keys | View user's SSH keys | Maintainer |
| Open Terminal | Open SSH terminal session (requires SSH keys, user not deleted) | Maintainer |
Cloud Providers
CloudWady integrates with major cloud providers for automated server provisioning and infrastructure management.
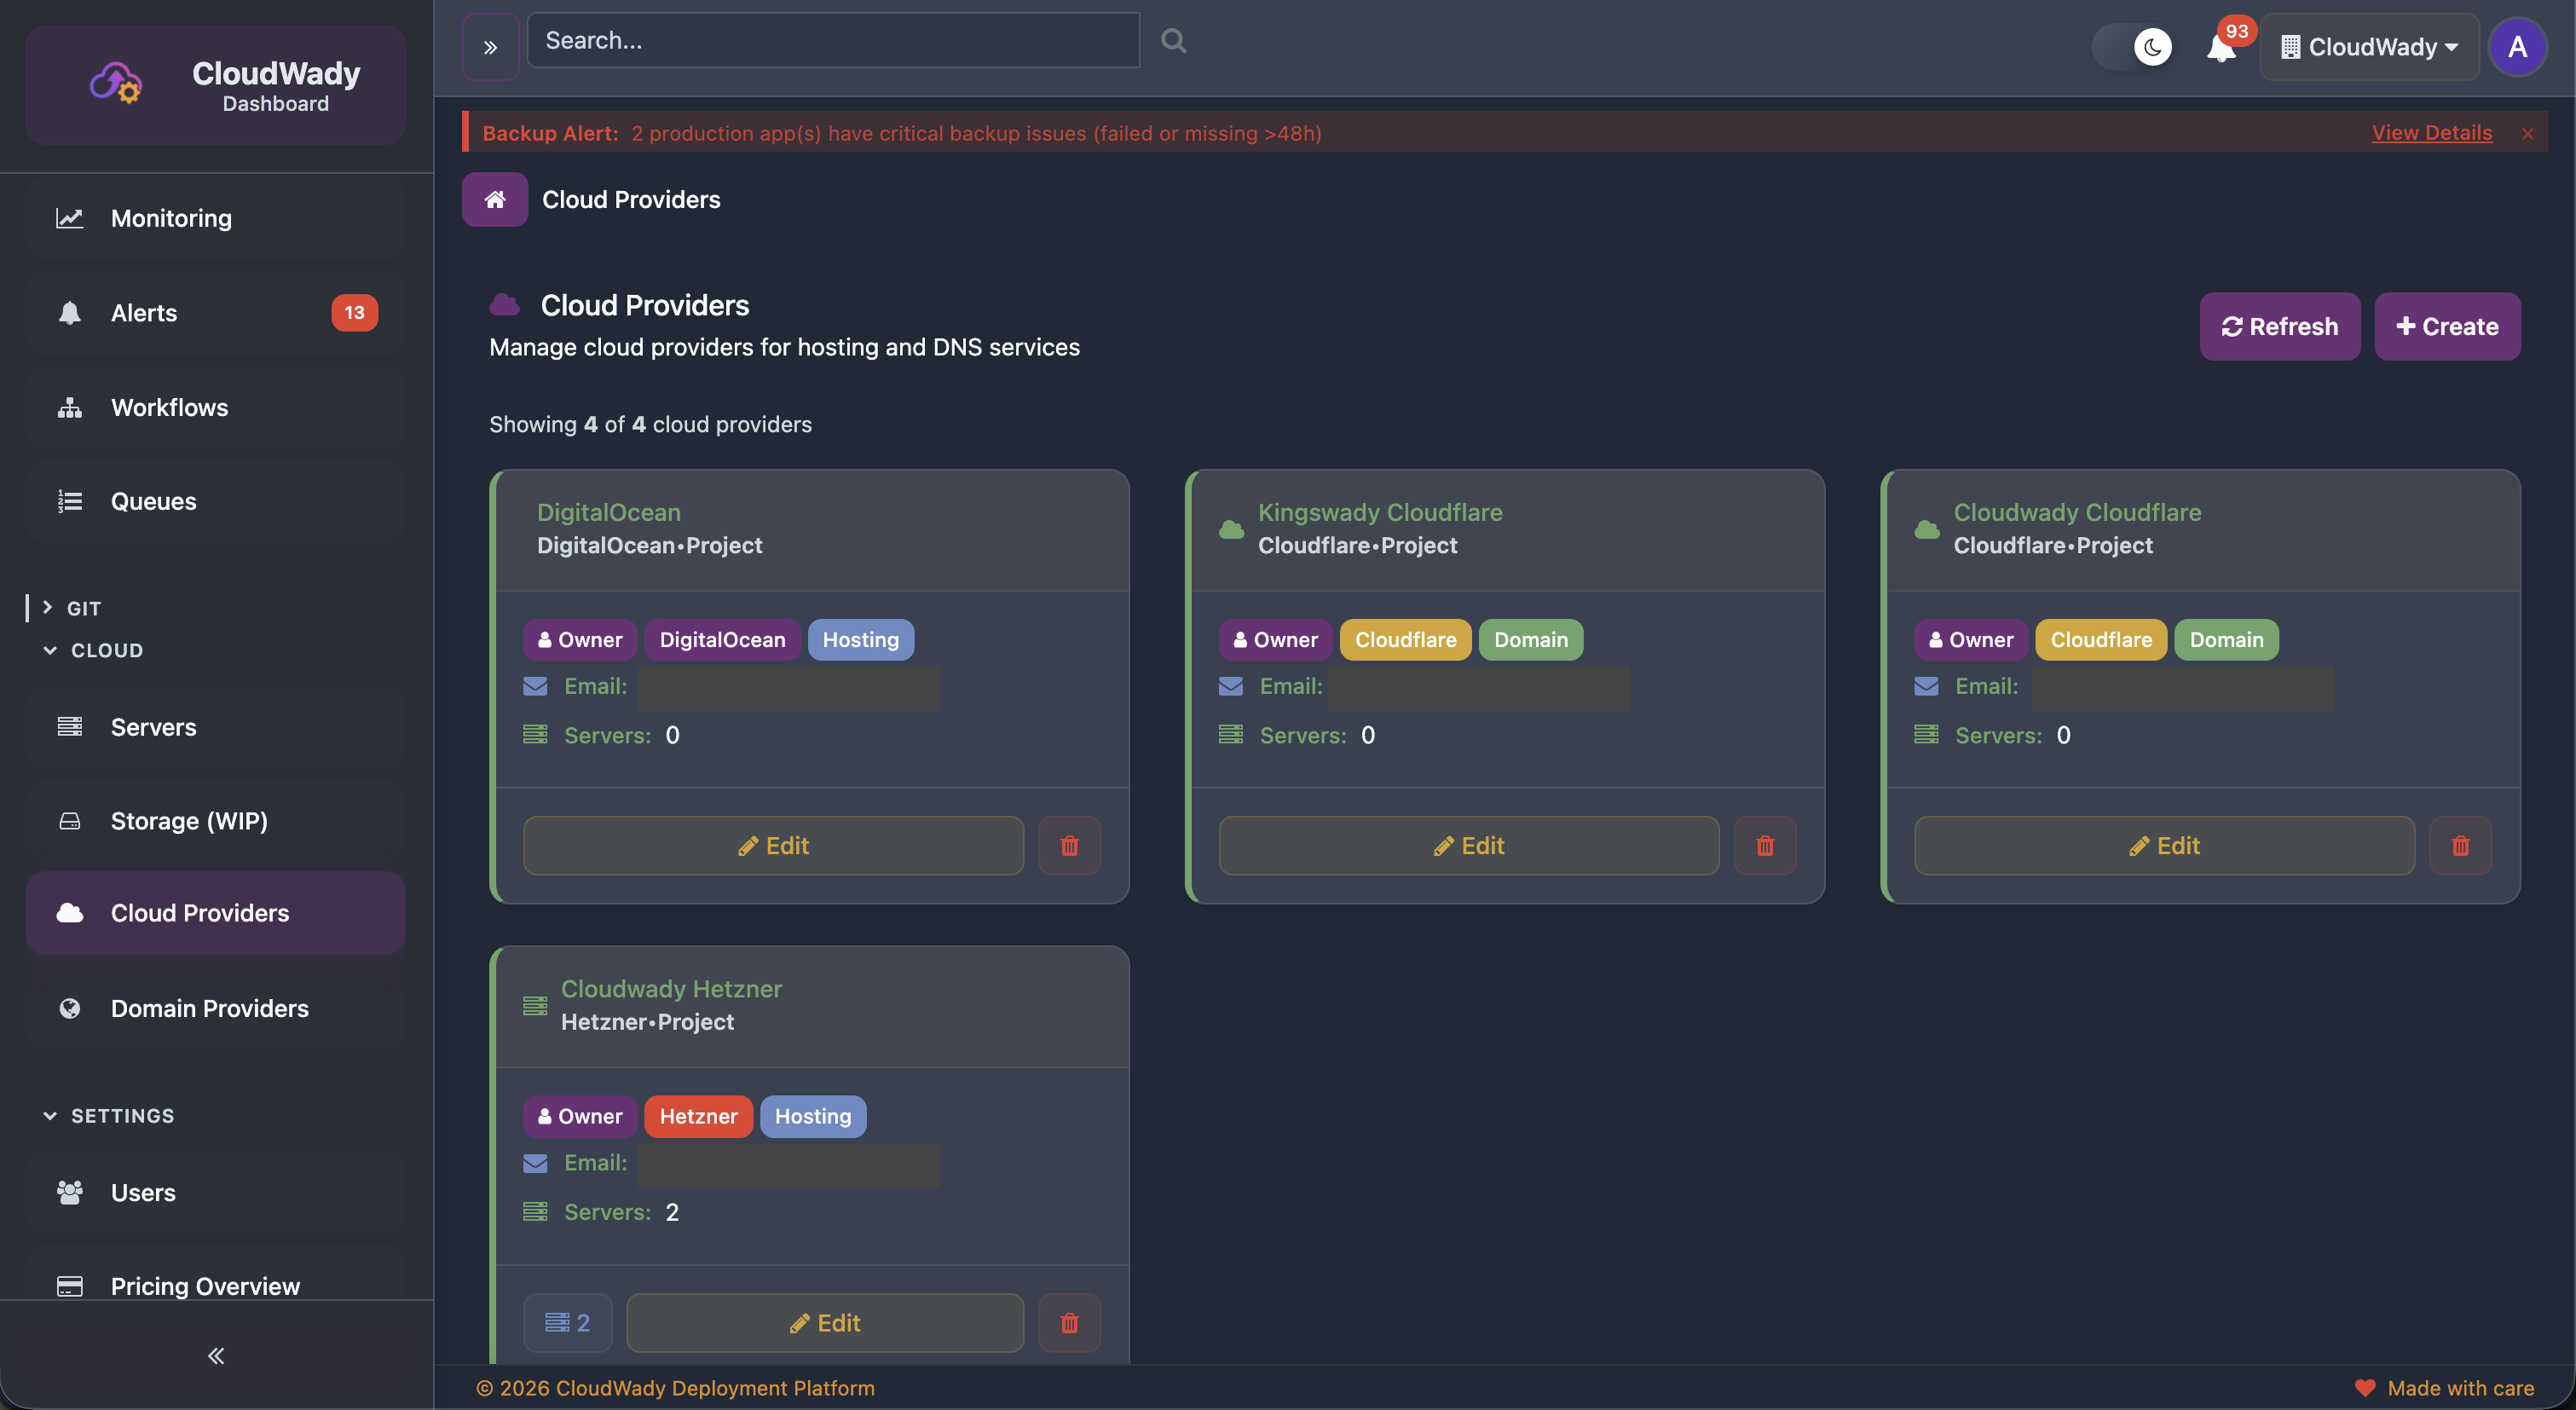
Each provider card shows: provider name, type badge (DigitalOcean/Hetzner/Cloudflare), role tag (Hosting/Domain), owner information, email, and server count.
Supported Providers
| Provider | Role | Features |
|---|---|---|
| Hetzner | Hosting | Server provisioning, storage boxes, volume management |
| DigitalOcean | Hosting | Droplet provisioning, volume management, DNS |
| Cloudflare | Domain | DNS management, SSL certificates, proxy configuration |
Available Actions
| Action | Description | Access Level |
|---|---|---|
| Create | Add a new cloud provider with API credentials | Maintainer |
| Refresh | Reload provider list and sync resources | Maintainer |
| View Servers | Navigate to servers for this provider (only shown if servers exist) | Viewer+ |
| Edit | Modify provider configuration or API keys | Maintainer |
| Delete | Remove a cloud provider connection | Admin |
Storage Boxes
Storage boxes define where your backups are uploaded. CloudWady supports SFTP, S3, and cloud volume storage.
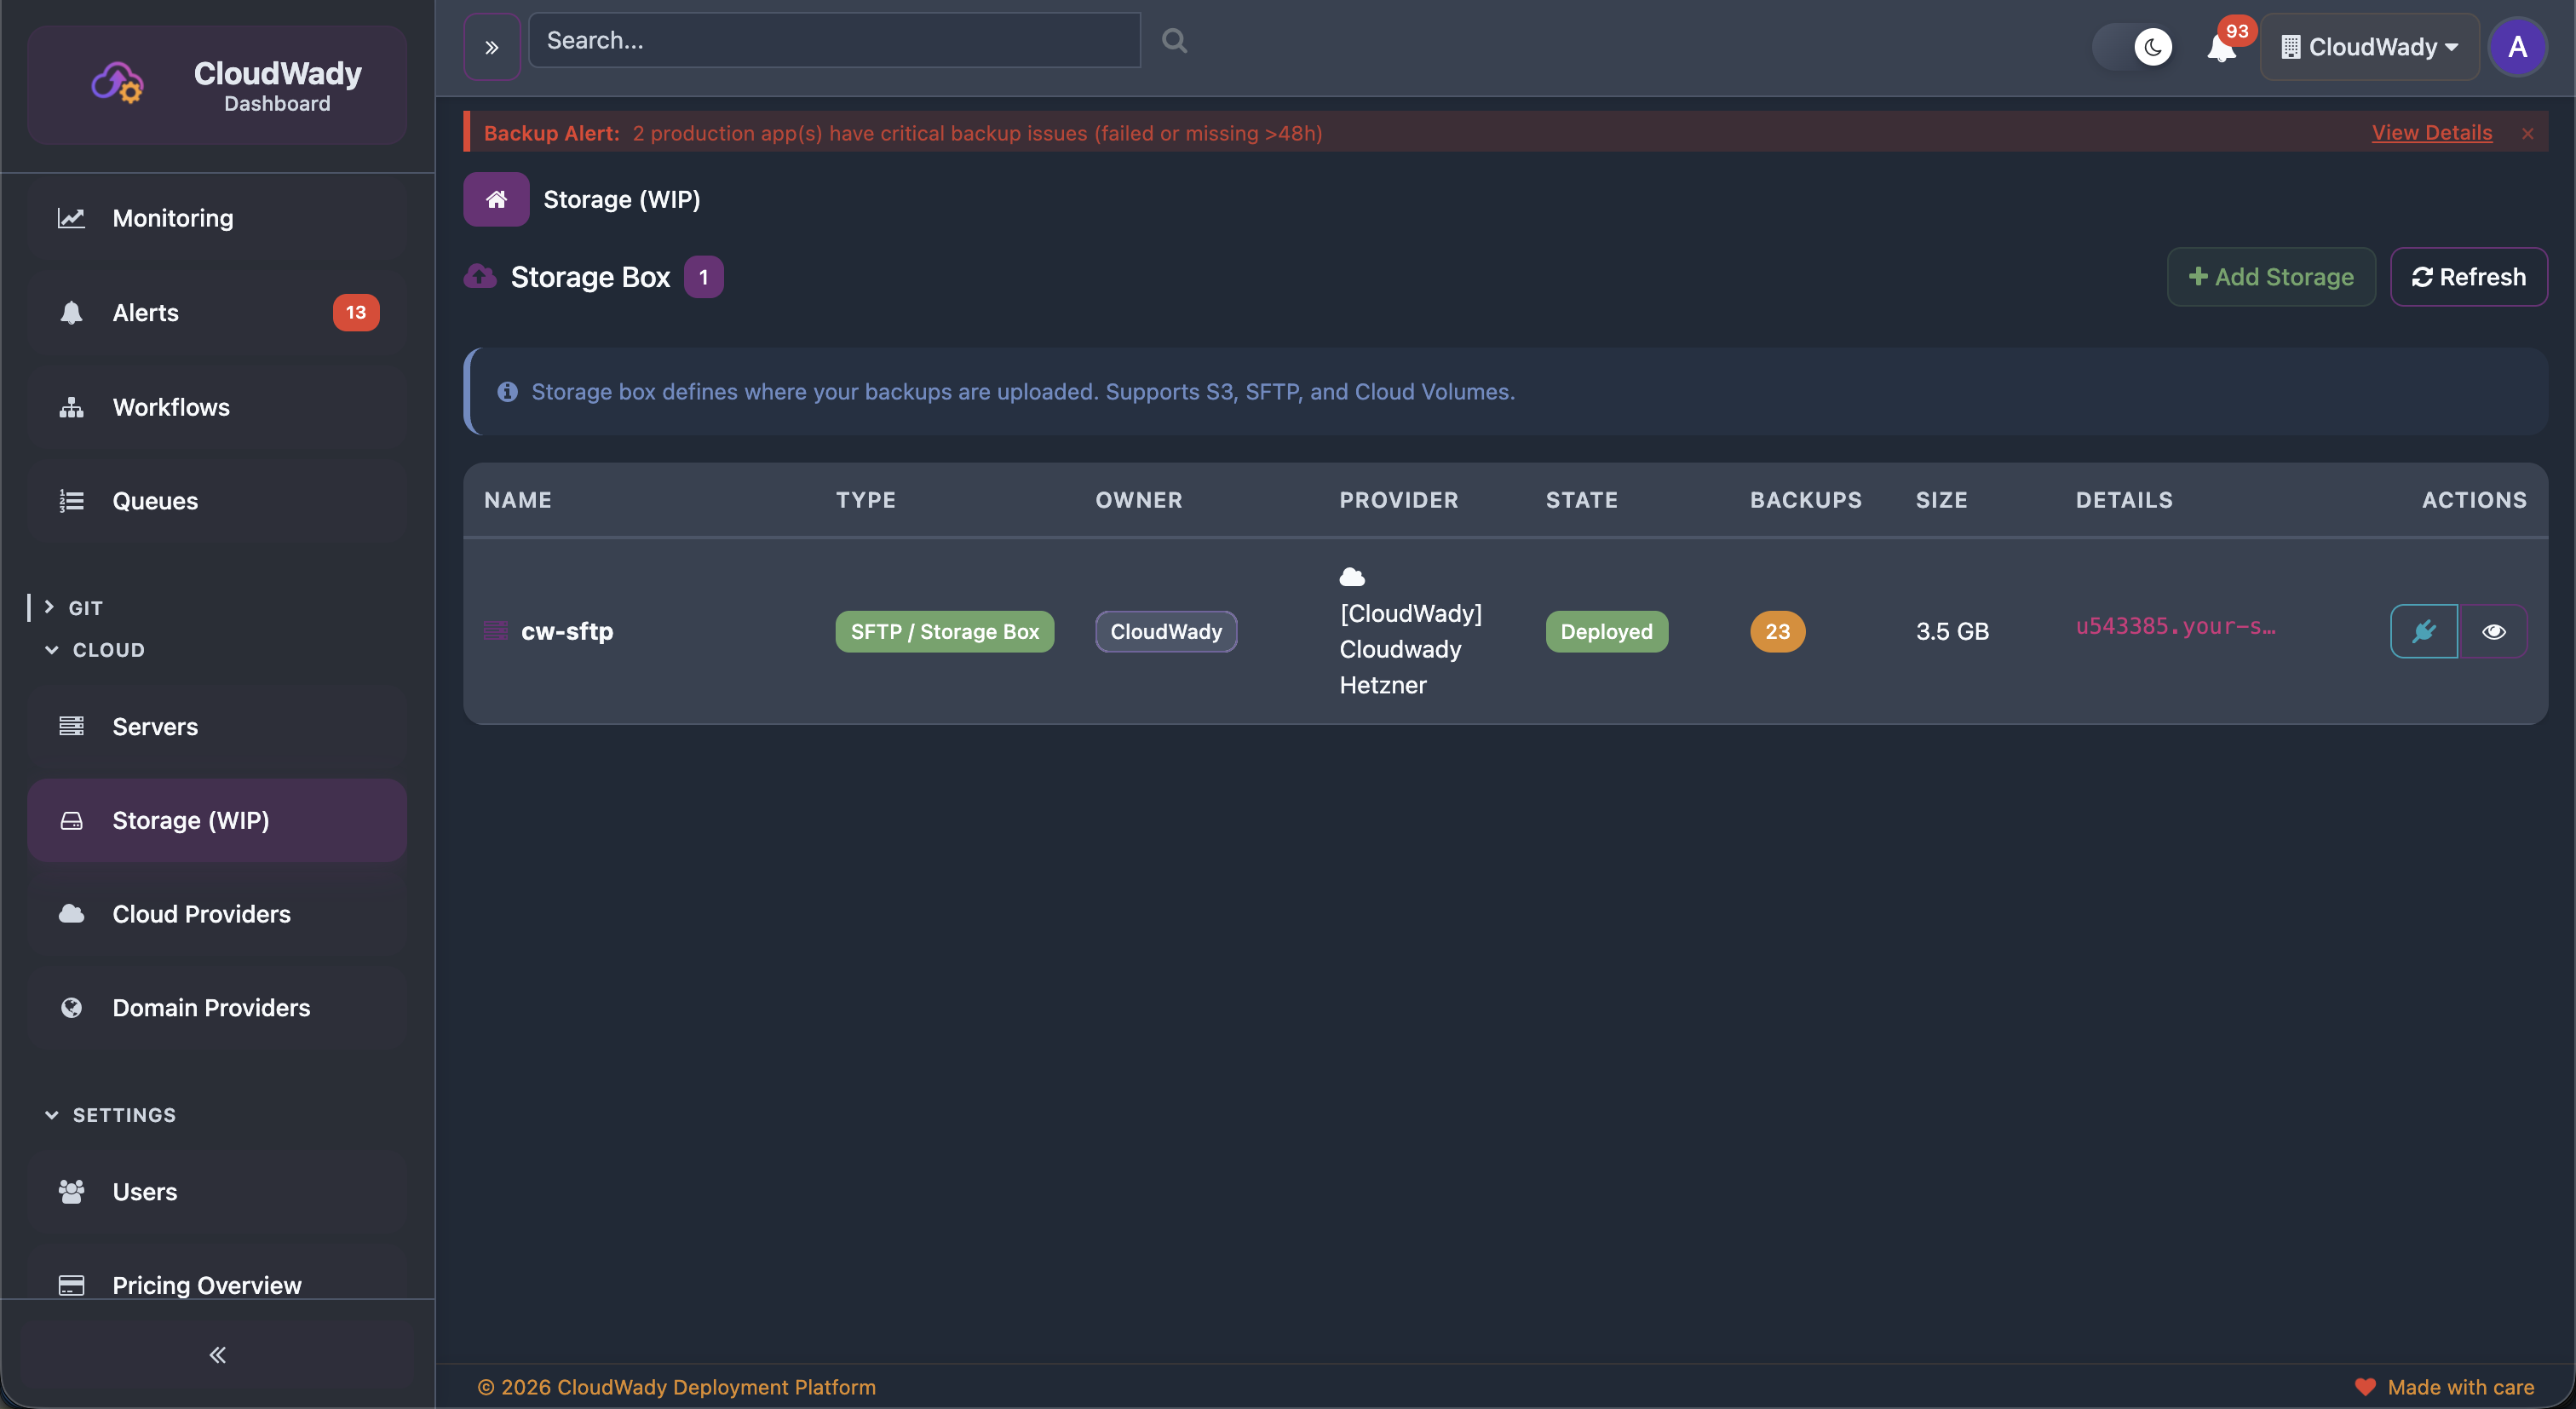
The storage table shows columns: Name, Type (SFTP/Storage Box), Owner, Provider, State, Backups count, Size, Connection Details, and Actions.
Storage Box Sidebar Navigation
| Menu Item | Icon | Description |
|---|---|---|
| Overview | fa-info-circle | Storage configuration with sub-tabs: Attachments, SSH Keys, Subaccounts |
| Backups | fa-database | Backup records stored in this box |
| Workflows | fa-sitemap | Storage-related workflow history |
| Variables | fa-cogs | Storage configuration variables (requires update permission) |
Available Actions
| Action | Description | Access Level |
|---|---|---|
| Add Storage | Create a new storage box configuration | Maintainer |
| Refresh | Reload storage box list | All |
| Expand | View detailed connection info (host, port, paths) | All |
| Delete | Remove a storage box | Admin |
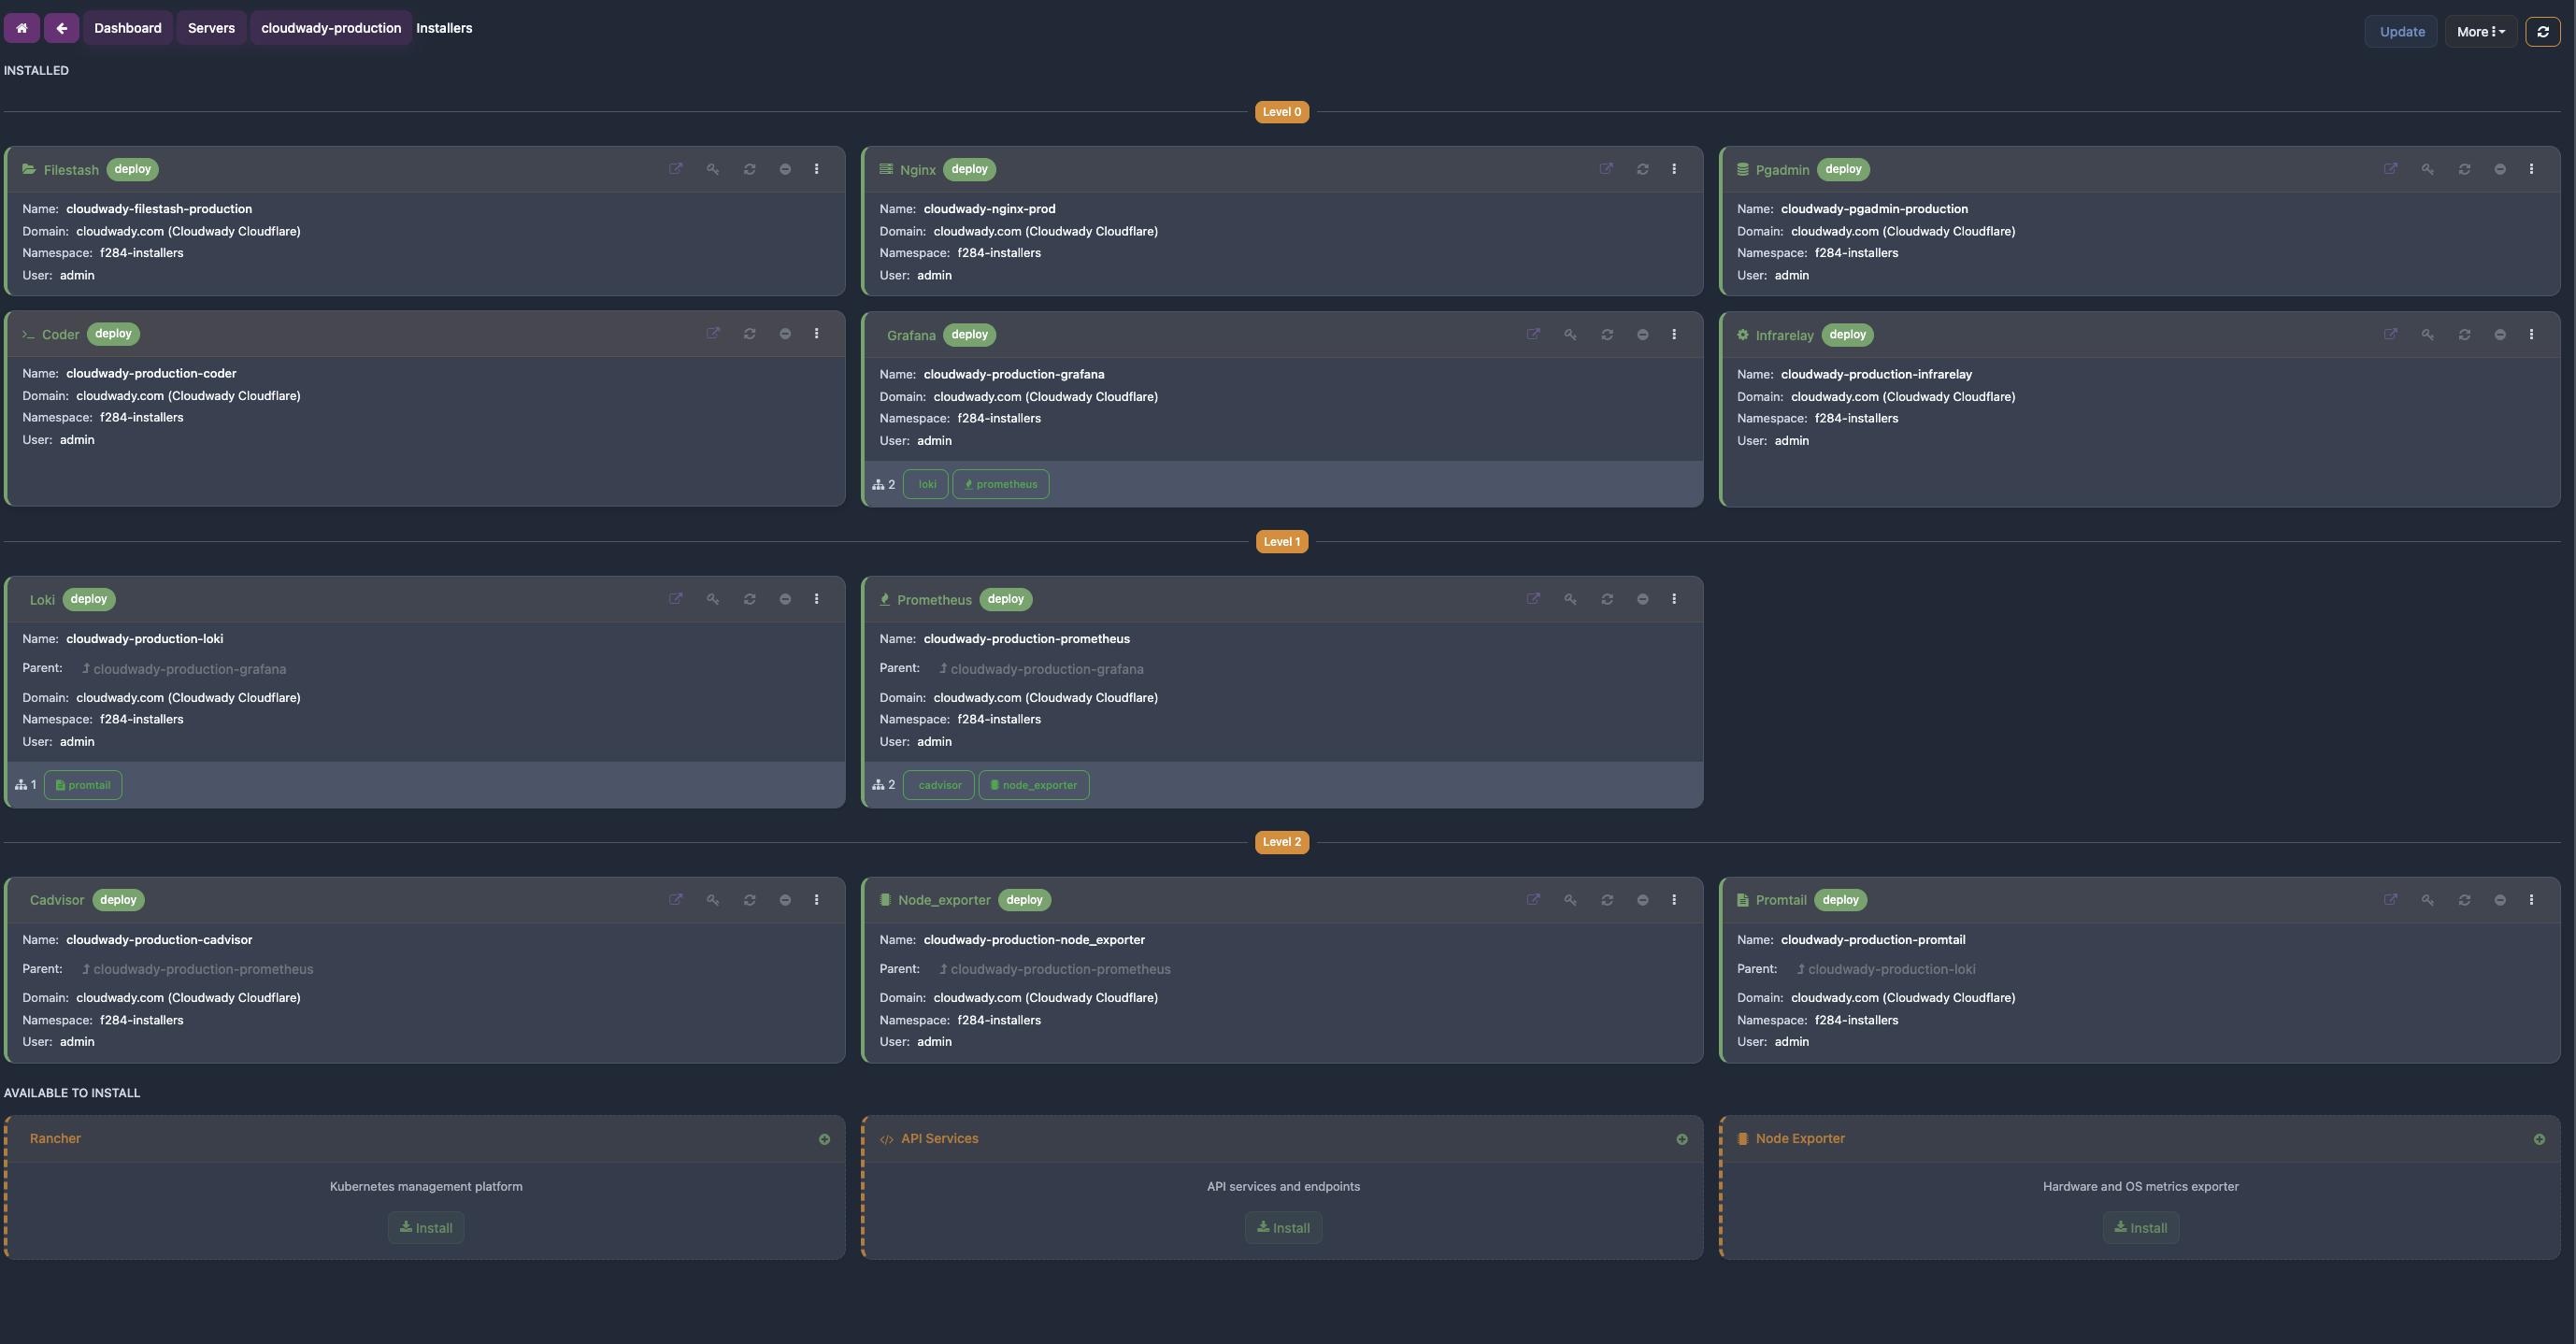
Installers
Installers are services deployed on your servers to provide infrastructure, monitoring, and developer tools. They are managed from the Installers menu in the server sidebar. Some are mandatory (auto-deployed on every server), while others are optional and can be deployed on demand.
Installer Sidebar
Each installer has its own detail screen with sidebar navigation:
| Menu Item | Icon | Description |
|---|---|---|
| Overview | fa-info-circle | Installer info with tabs: Overview (Core), URLs (Network) |
| Workflows | fa-sitemap | Installer workflow execution history |
| Variables | fa-cogs | Installer configuration variables (requires update permission) |
Available Actions
| Action | Description | Condition |
|---|---|---|
| Open | Launch the service URL in a new browser tab | Service URL available |
| Get Password | Copy the service password to clipboard | Service has a password |
| Deploy | Deploy the installer to the server | State is not deployed |
| Update | Update the deployed installer | State is deployed |
| Uninstall | Remove the deployed installer from the server | State is deployed, not a root type |
| Delete | Delete the installer record | State is not deployed |
Mandatory Services
These services are automatically deployed on every server and cannot be removed. They provide the core infrastructure that all other services depend on.
Nginx
Reverse proxy and web server. Routes incoming traffic to all deployed applications and installers on the server. Automatically configured whenever apps or services are deployed — handles SSL termination, load balancing, and URL routing.
API Services
Internal API layer for server communication. Handles health checks, metrics collection, and management commands between CloudWady and the server. Required for all server operations.
Monitoring & Metrics
These services collect and visualize server and application data. Node Exporter, Promtail, and cAdvisor feed metrics and logs back to CloudWady's monitoring dashboards.
Grafana
Monitoring dashboards for visualizing server and application metrics. Displays data collected by Prometheus in interactive charts — CPU usage, memory, disk I/O, network traffic, and more. Accessible via its own service URL on the server.
Prometheus
Metrics collection engine. Scrapes and stores time-series data from Node Exporter (host metrics) and cAdvisor (container metrics). Powers the Grafana dashboards with historical and real-time data.
Node Exporter
Host system metrics agent. Exports CPU, memory, disk, and network data to Prometheus. This data is displayed in CloudWady's System Monitoring dashboards, giving you visibility into server health without leaving the platform.
cAdvisor
Container metrics agent. Exports per-container resource usage (CPU, memory, network, filesystem) to Prometheus. CloudWady uses this data to show resource consumption per application in the monitoring dashboards.
Loki
Log aggregation system. Collects and indexes application logs for efficient querying and analysis via Grafana. Works together with Promtail to provide a complete logging pipeline.
Promtail
Log collector agent. Ships container and application logs to Loki for storage and indexing. CloudWady displays these logs in the Application Logs monitoring dashboard, enabling real-time log viewing with filtering by level, module, and time range.
Developer Tools
Web-based tools for database management, code editing, and file browsing. Deploy them on your servers and access via their service URLs.
pgAdmin
Web-based PostgreSQL administration tool. Provides a graphical interface for managing databases, running SQL queries, viewing table structures, and monitoring database performance. Once deployed, access it via the service URL with the generated credentials.
Coder (Code Server)
Cloud-based IDE accessible from the browser. Provides a full VS Code editing experience directly on the deployment server — edit code, run terminal commands, and manage files without needing SSH access. Useful for quick configuration changes and debugging.
Filestash
Web-based file manager for browsing and managing files on the server. Upload, download, edit, and organize files through a familiar explorer interface. Supports SFTP connections to storage boxes for backup file management.
System Monitoring
CloudWady embeds Grafana dashboards directly in the platform for comprehensive server and application monitoring.
Server Metrics
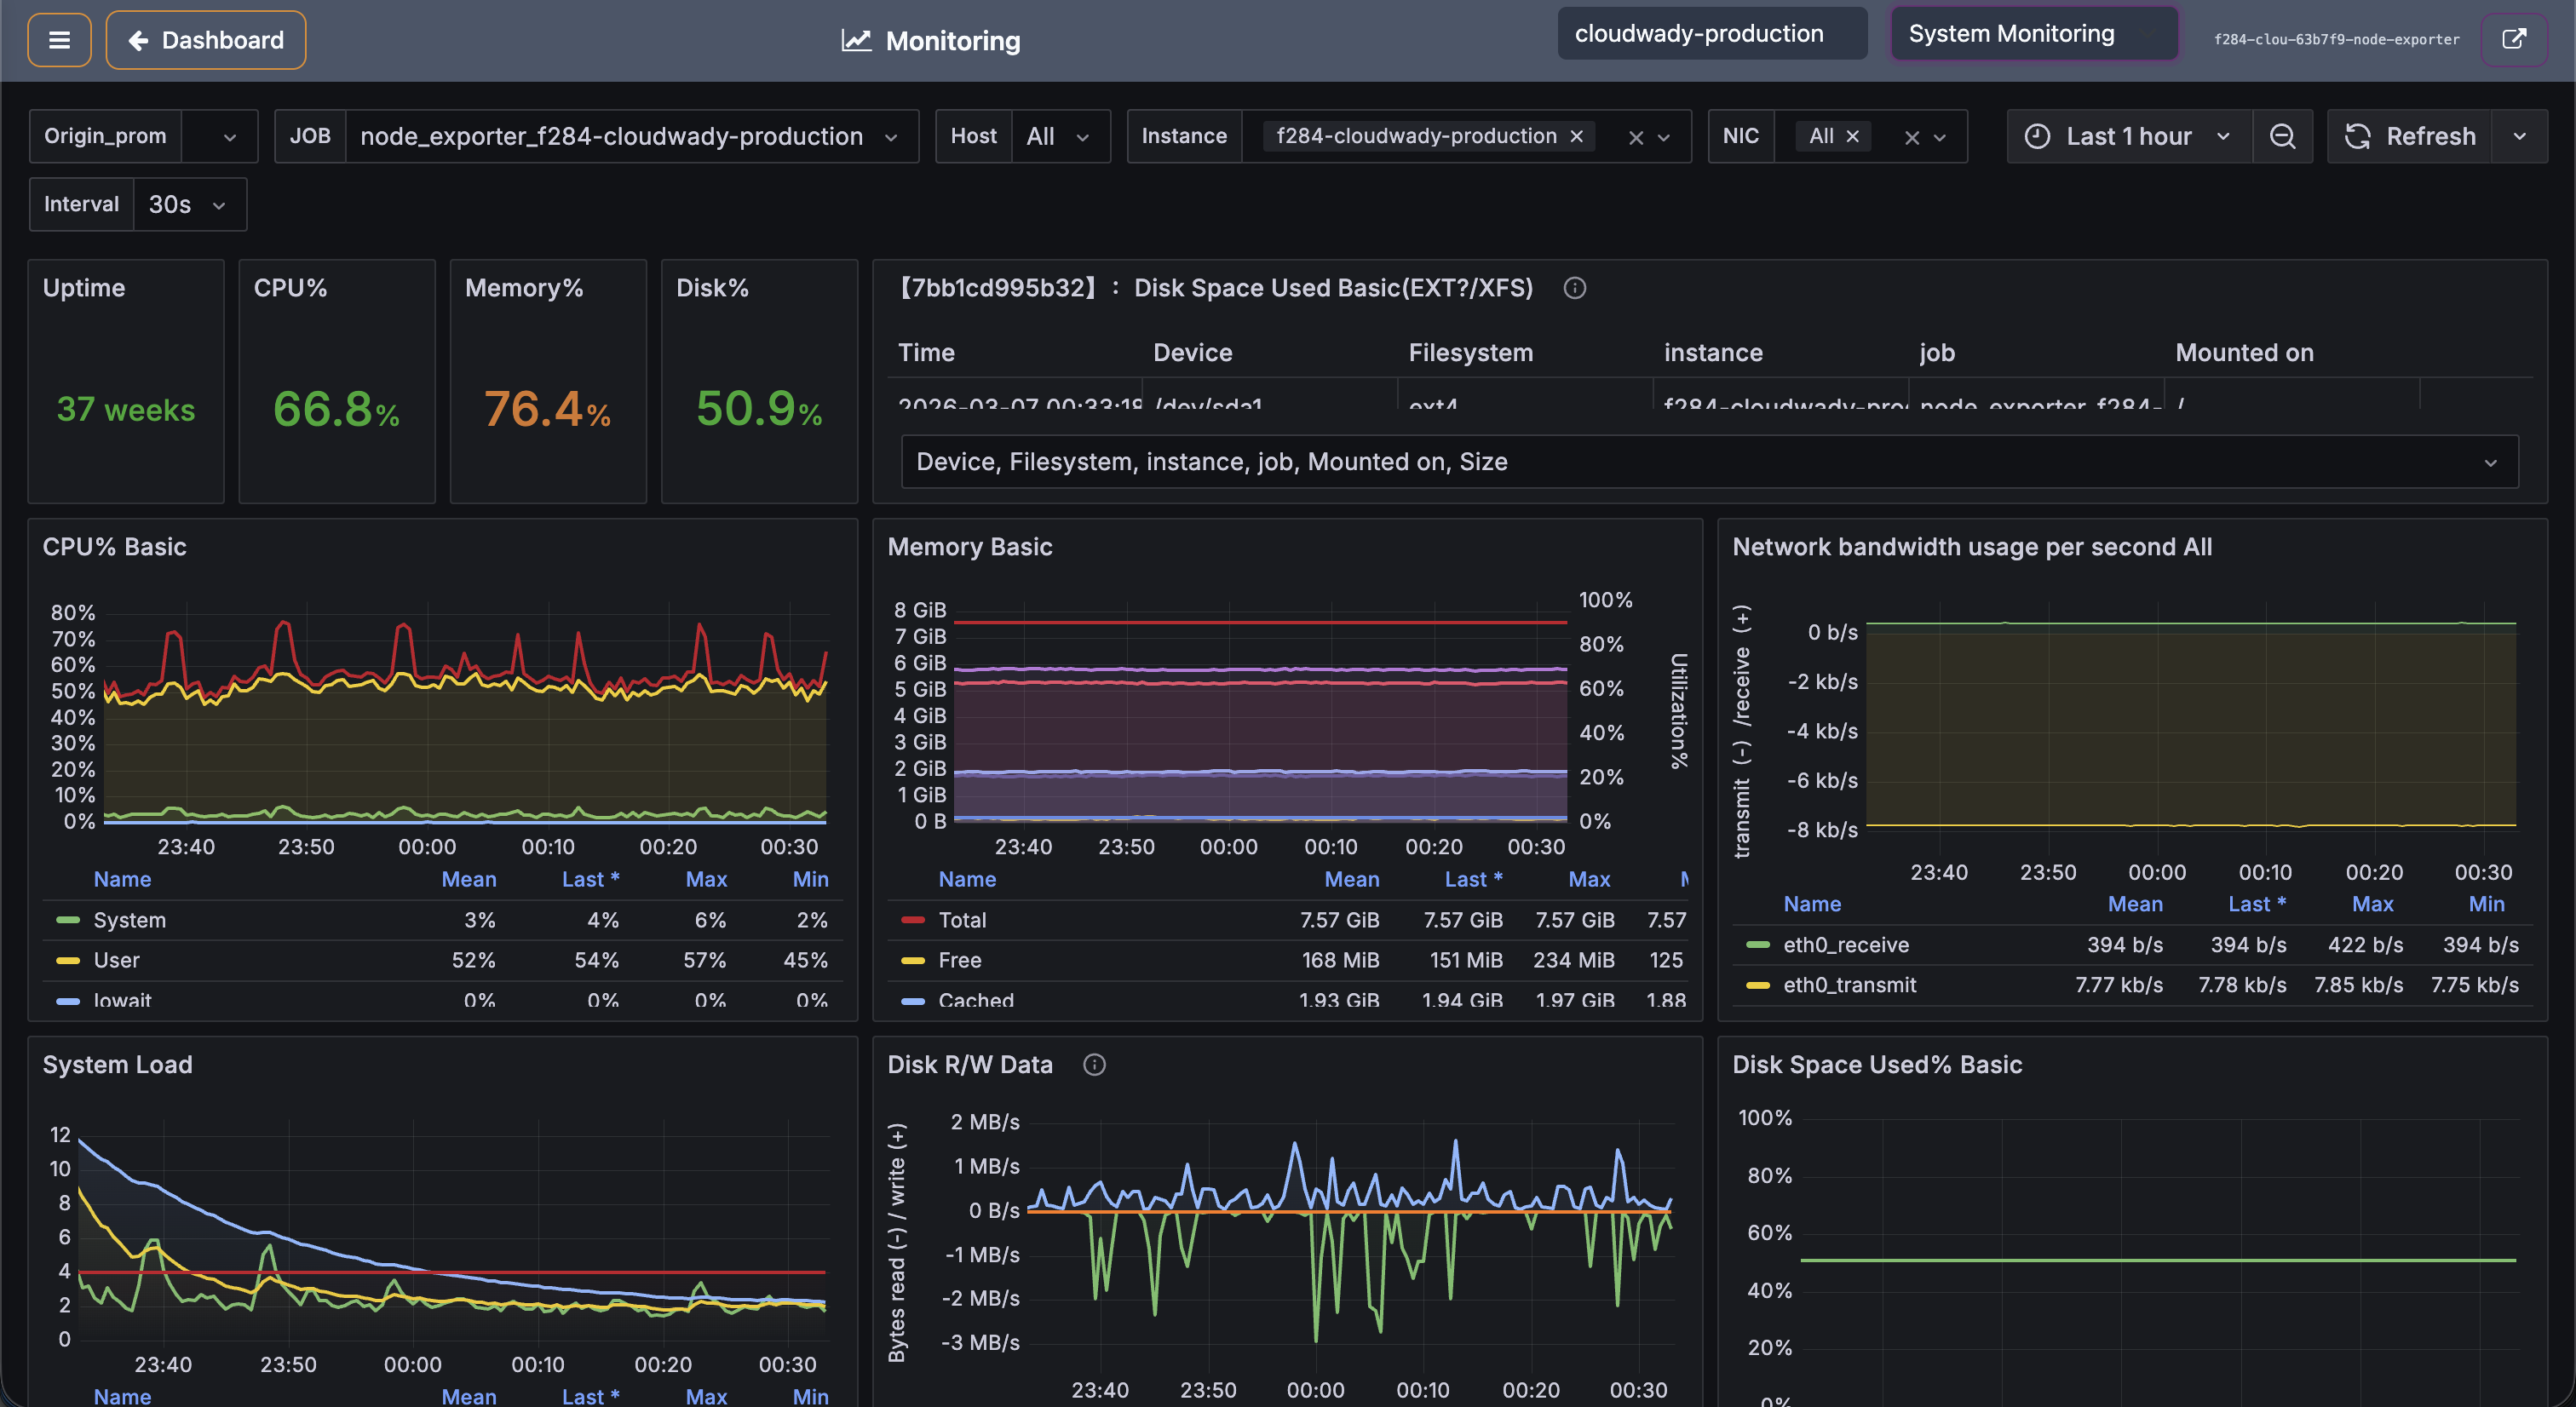
The system monitoring dashboard shows real-time metrics at a glance: Uptime, CPU usage, Memory usage, and Disk percentage. Detailed charts include:
- CPUs Basic: CPU usage over time with per-core breakdown.
- Memory Basic: RAM usage trends with total/used/free.
- Network Bandwidth: Incoming and outgoing network traffic.
- System Load: Load average (1m, 5m, 15m).
- Disk Write Data: Disk I/O performance metrics.
Application Logs
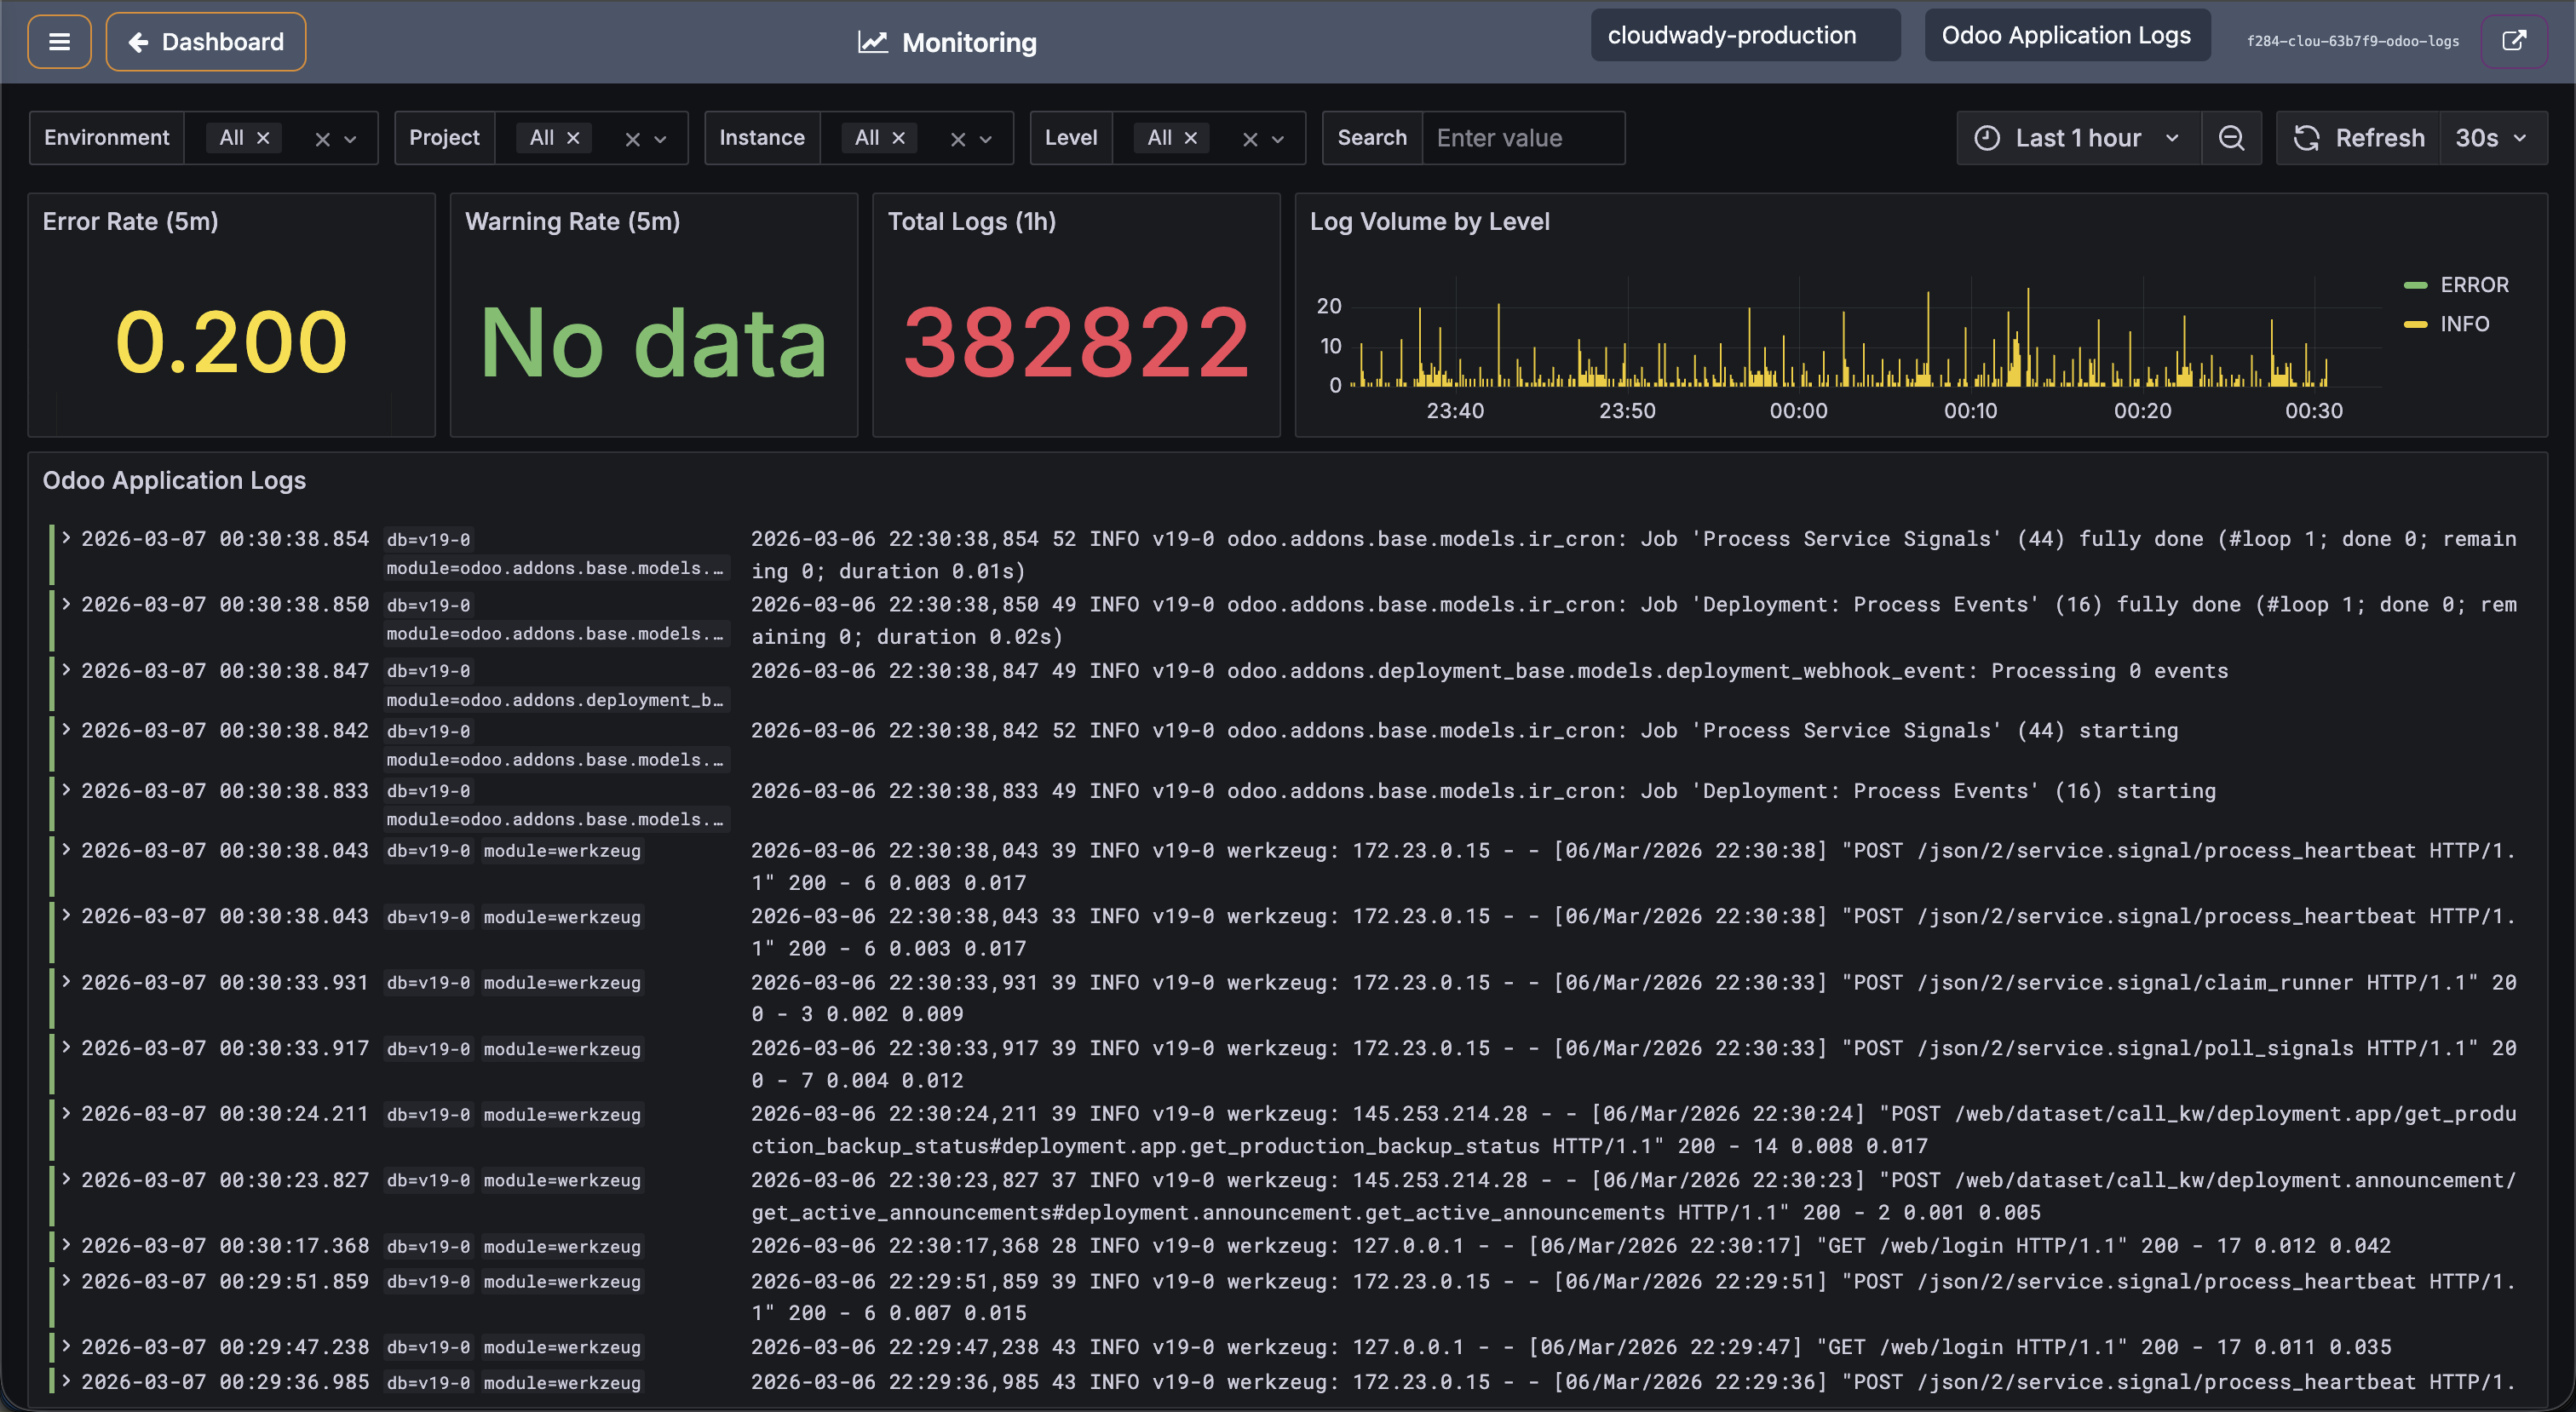
Switch to the Application Logs dashboard to view: error log counters, log volume charts over time, and detailed log entries with timestamps, log levels, module names, and full message content including stack traces.
Available Actions
| Action | Description | Access Level |
|---|---|---|
| Toggle Aside | Show or hide the sidebar navigation | All |
| Back to Dashboard | Return to the main dashboard | All |
| Server selector | Choose which server to monitor (searchable dropdown) | Viewer+ |
| Dashboard selector | Switch dashboard type: node-exporter (System) or docker-logs (Application Logs) | Viewer+ |
| Open in New Tab | Open the Grafana dashboard in a new browser tab | Viewer+ |
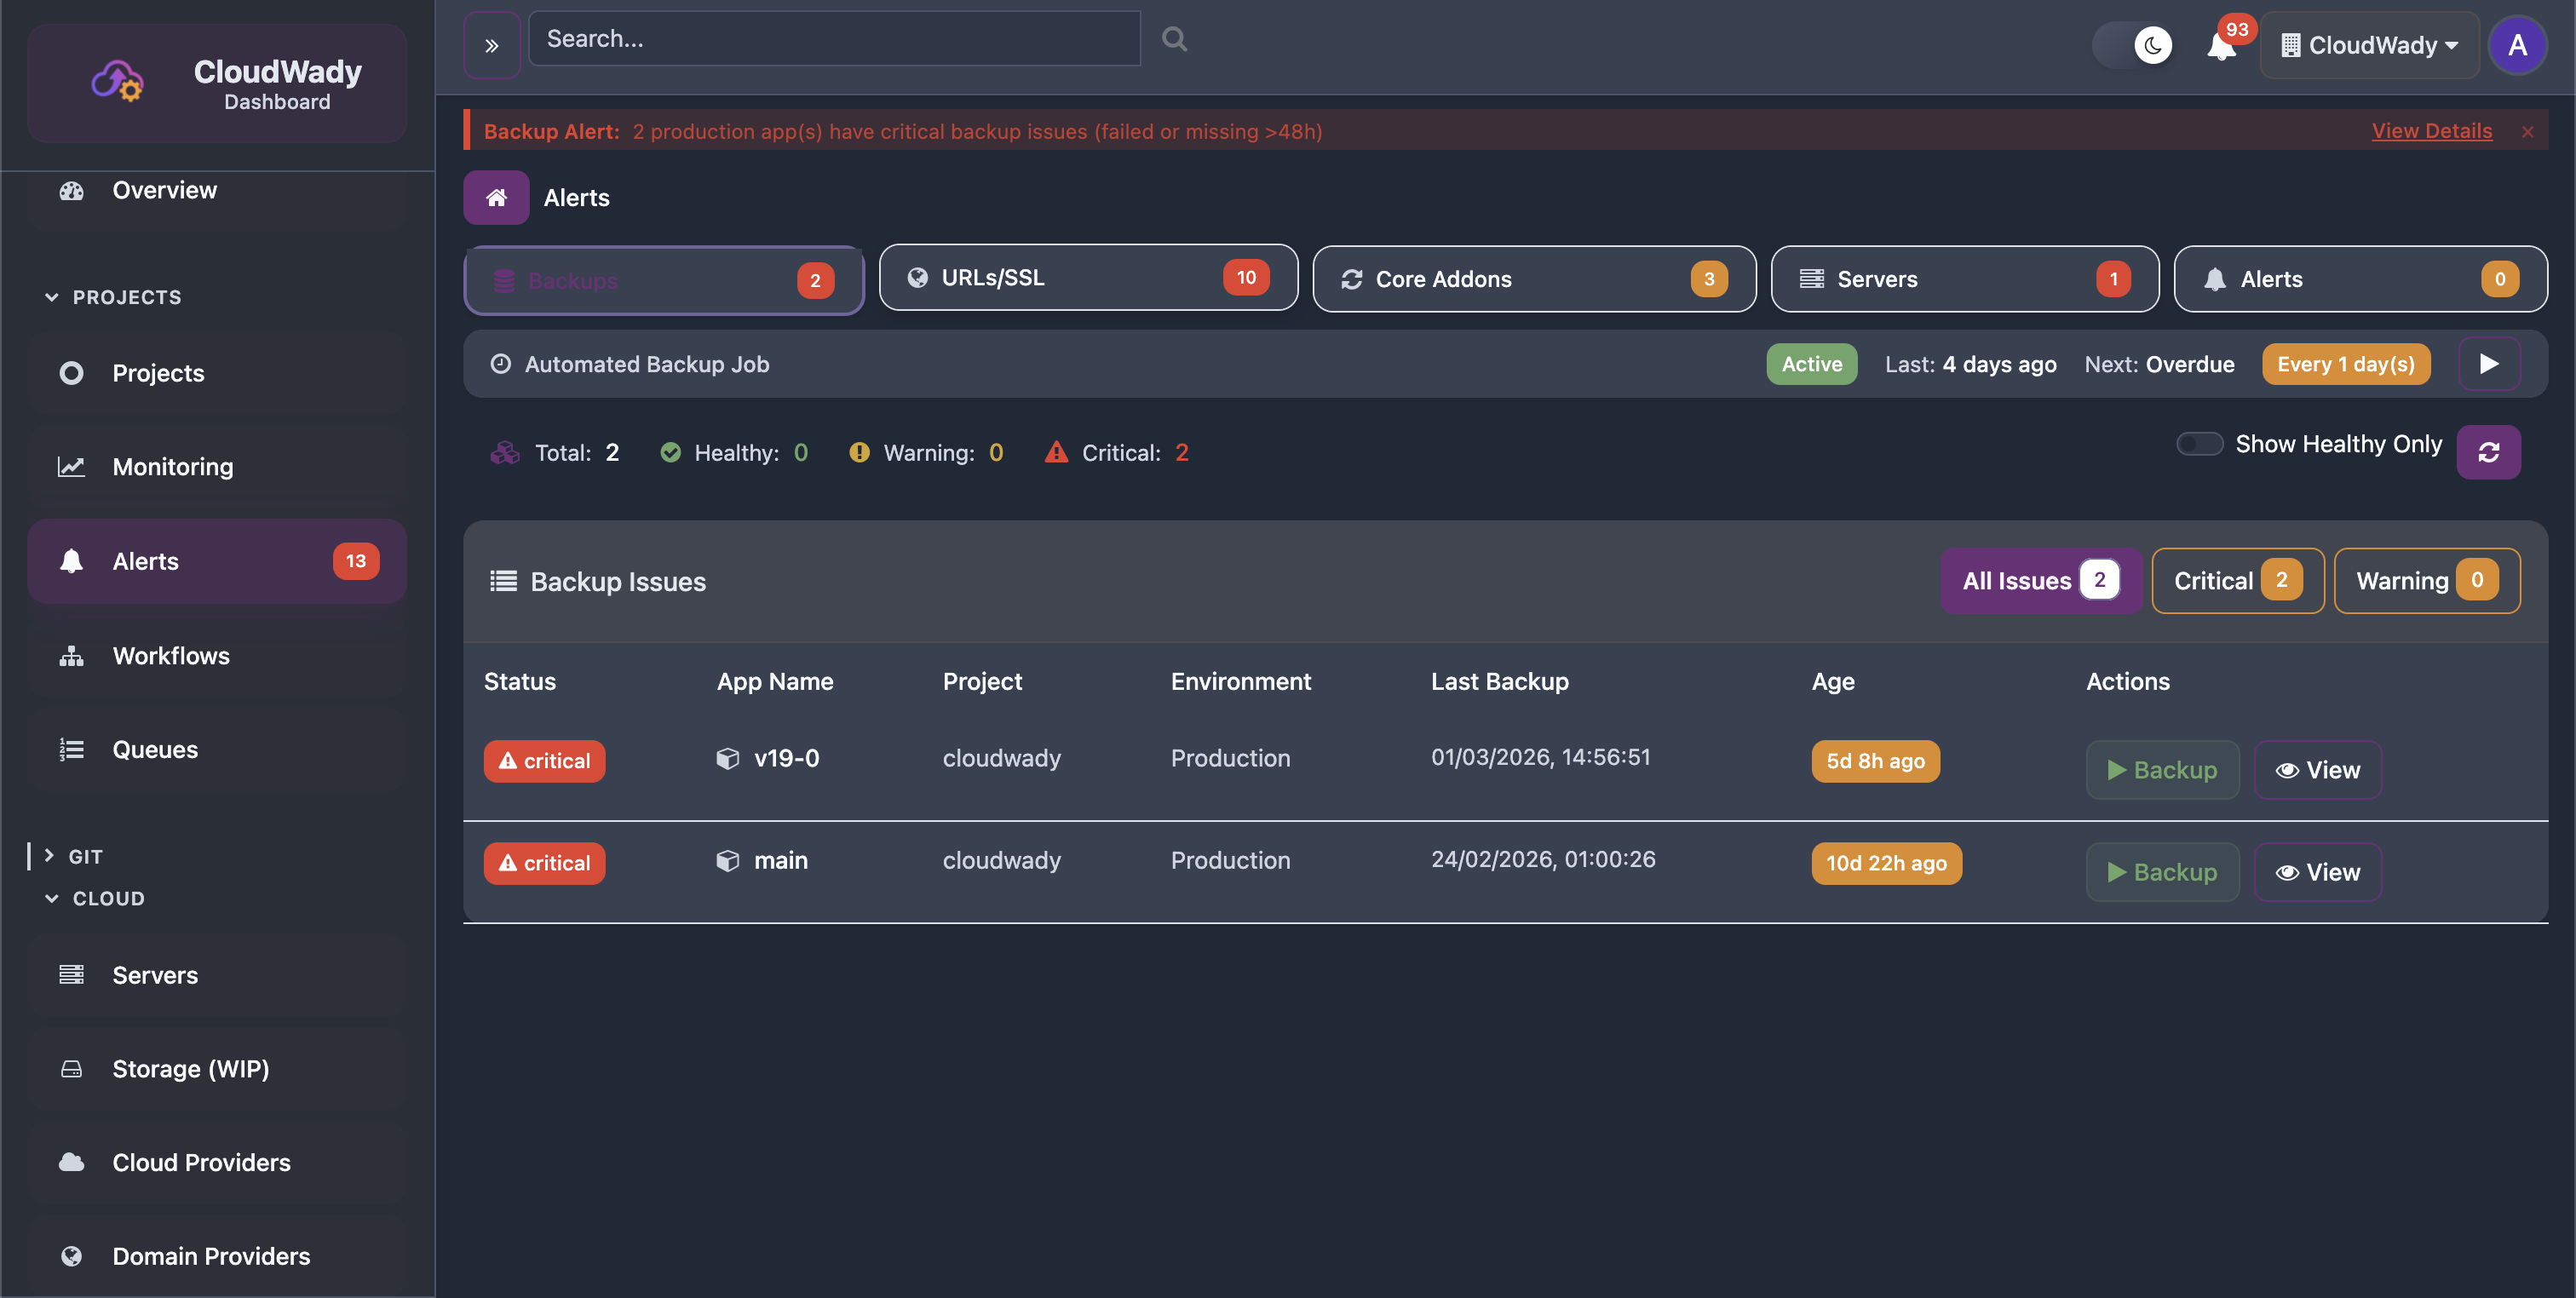
Backup Alerts
The Backup Alerts tab monitors the health of automated backups across all production applications.
Alert Screen Tabs
The Alerts screen is organized into 5 tabs, each showing a total count and issues count:
| Tab | Icon | Description |
|---|---|---|
| Backups | fa-database | Monitor backup health for all production deployments |
| URLs | fa-globe | Monitor SSL certificates and URL status |
| Servers | fa-server | Monitor server cleanup status across environments |
| Alerts | fa-bell | Manage alert integrations and view recent alerts |
| Core Addons | fa-refresh | Bulk update shared Odoo addons across projects |
The Backup tab shows health counters: Total, Healthy, Warning, and Critical. The issues table displays:
- Status: Critical or Warning indicators.
- App Name: The affected application.
- Project & Environment: Where the app runs.
- Last Backup: When the last successful backup was created.
- Age: Color-coded age badge (orange for overdue).
Available Actions
| Action | Description | Access Level |
|---|---|---|
| Backup | Trigger an immediate backup for the affected app (play icon) | Developer+ |
| View | Navigate to the app's backup screen (eye icon) | Viewer+ |
| Show Healthy Only | Toggle to show only healthy backup statuses | All |
| Refresh | Reload backup alert data | All |
| Filter tabs: All Issues / Critical / Warning | Filter by severity with issue counts | All |
SSL & URL Alerts
The SSL/URL tab monitors certificate validity and URL availability across all applications.
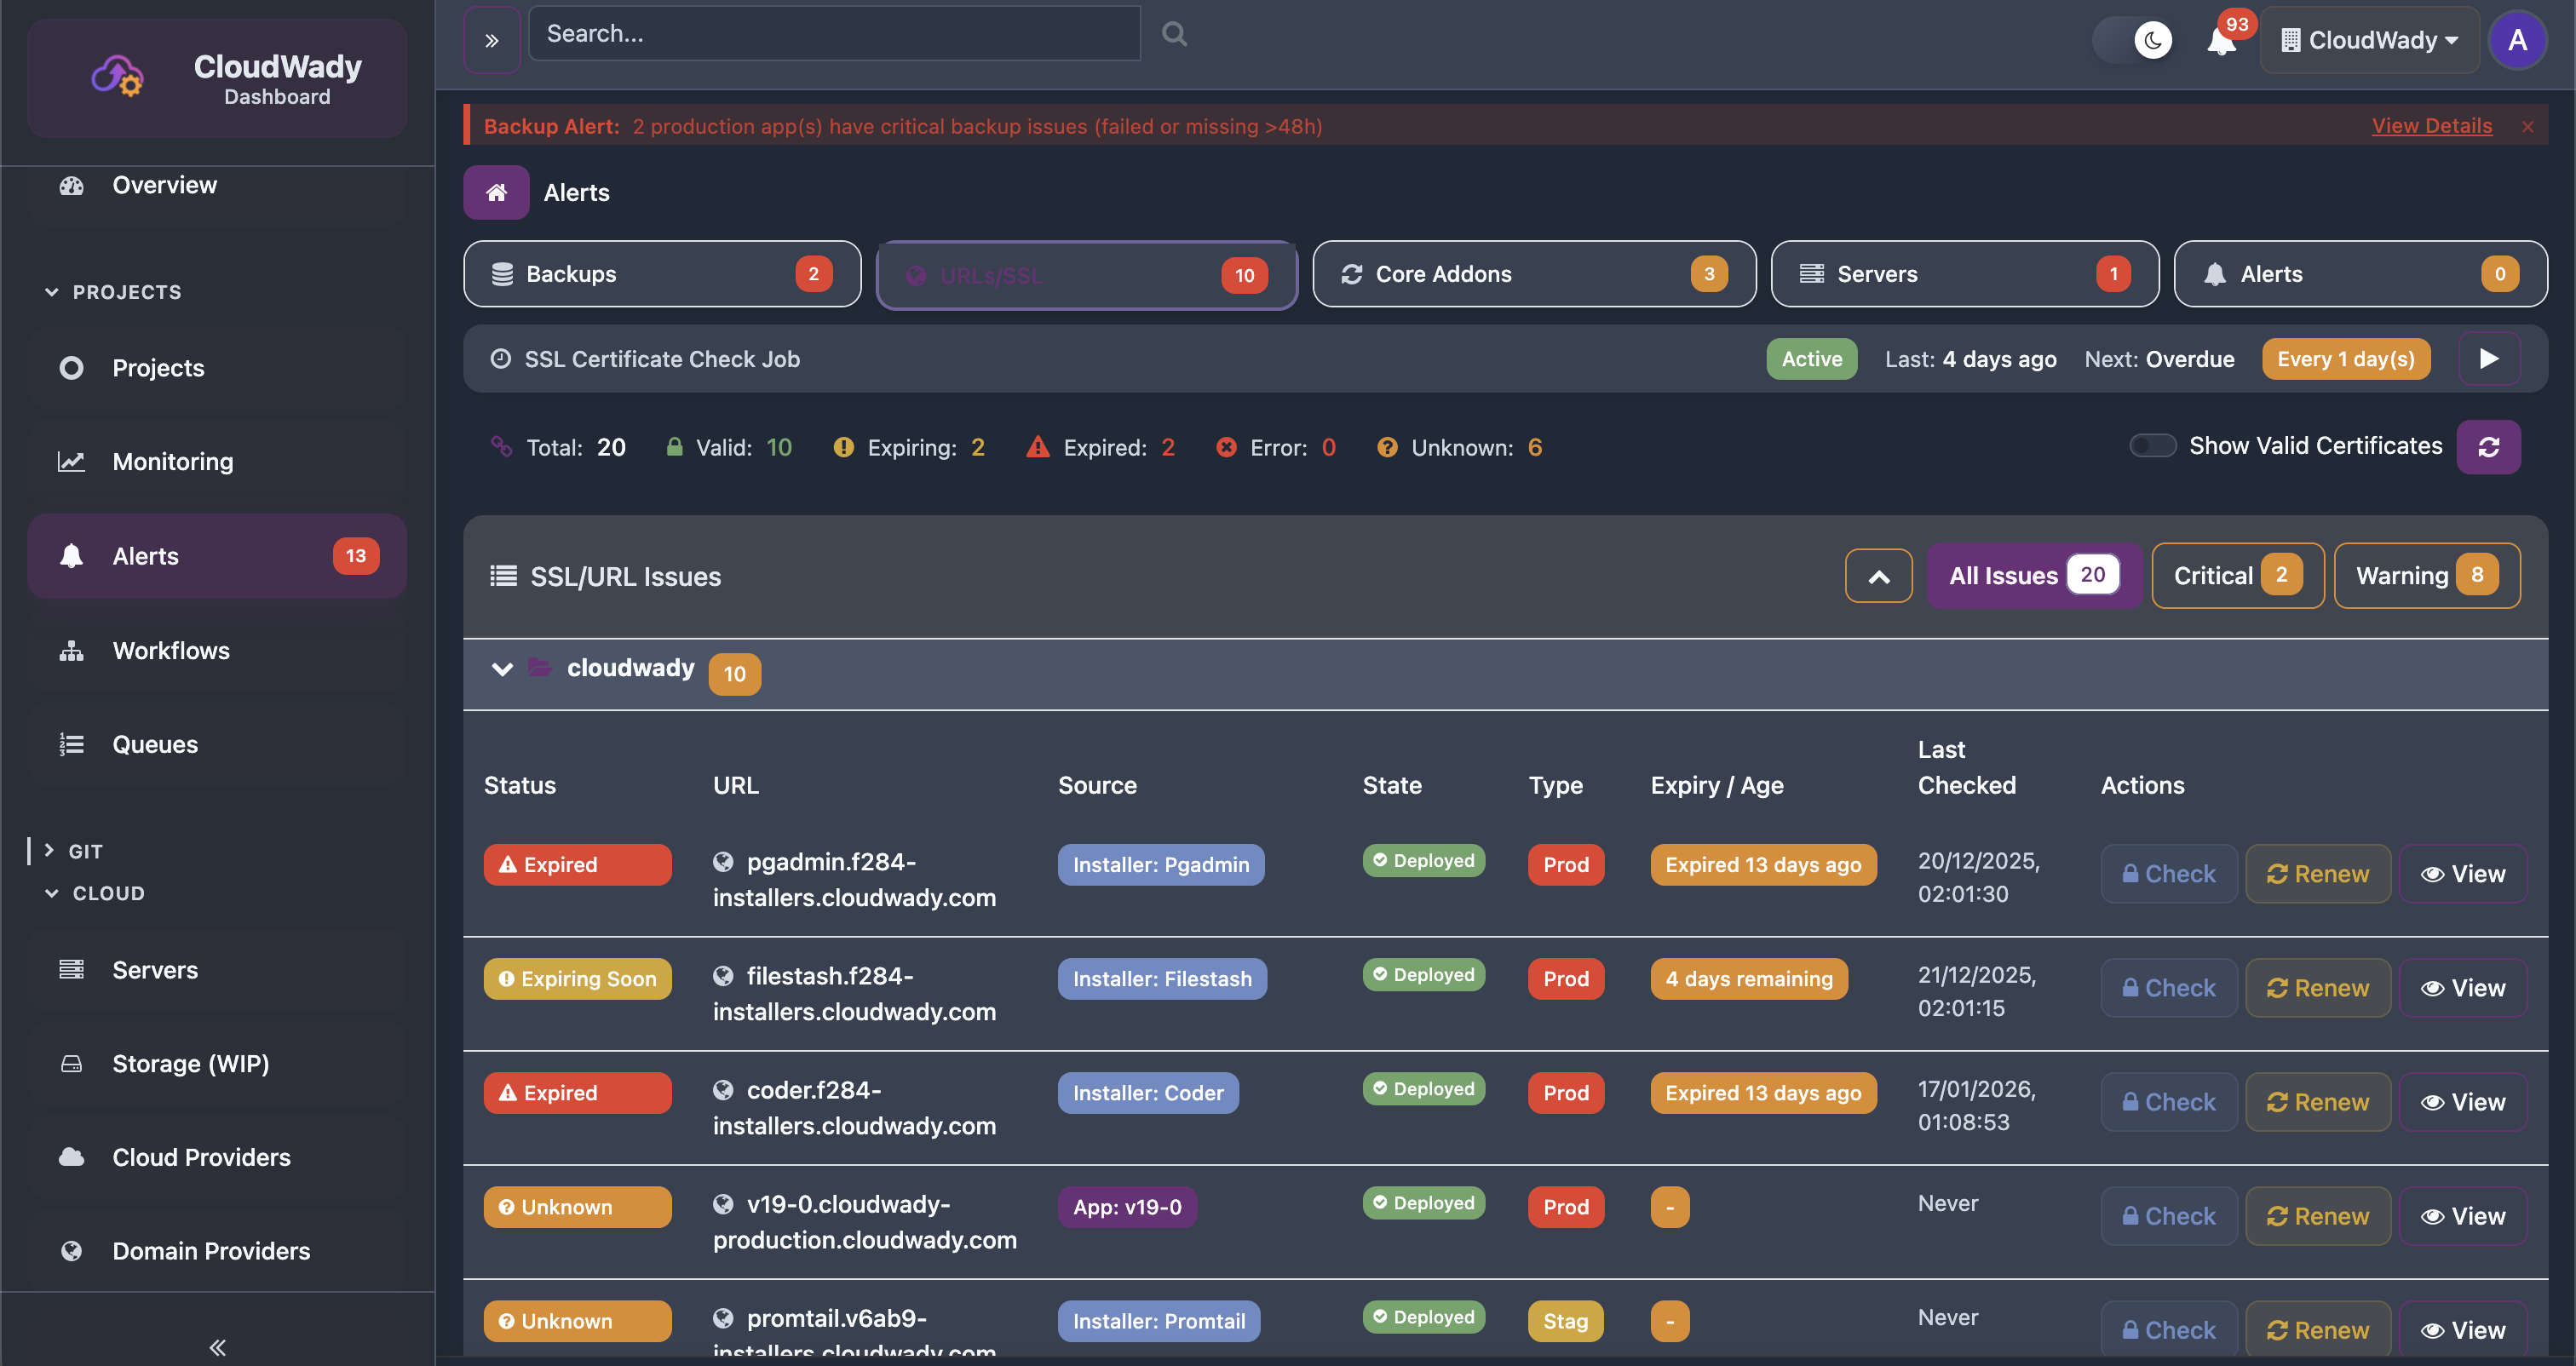
Stats cards show: Total URLs, Valid, Expiring Soon, Expired, Error, Unknown. The alerts table shows:
- Status: Red for expired, orange for expiring soon.
- URL: The monitored endpoint with lock icon.
- Source: Detection method (Google, Prometheus).
- State: Current certificate state.
- Type: Alert severity classification.
- Expiry/Age: Certificate expiry date with color coding.
- Last Detected: When the issue was last confirmed.
Available Actions
| Action | Description | Access Level |
|---|---|---|
| Check | Check SSL certificate status for a URL (lock icon) | Maintainer |
| Renew | Trigger SSL certificate renewal (refresh icon) | Maintainer |
| View | Navigate to the source app/installer details (eye icon) | Viewer+ |
| Show Valid Certificates | Toggle to include valid (non-alerting) certificates | All |
| Refresh | Reload URL monitoring data (shows auto-refresh "3s" badge when workflows active) | All |
| Collapse All / Expand All | Toggle all URL groups collapsed or expanded | All |
| Filter tabs: All Issues / Critical / Warning | Filter by severity with issue counts | All |
Core Addons Updates
The Core Addons tab tracks whether deployed applications are running the latest core addon versions.
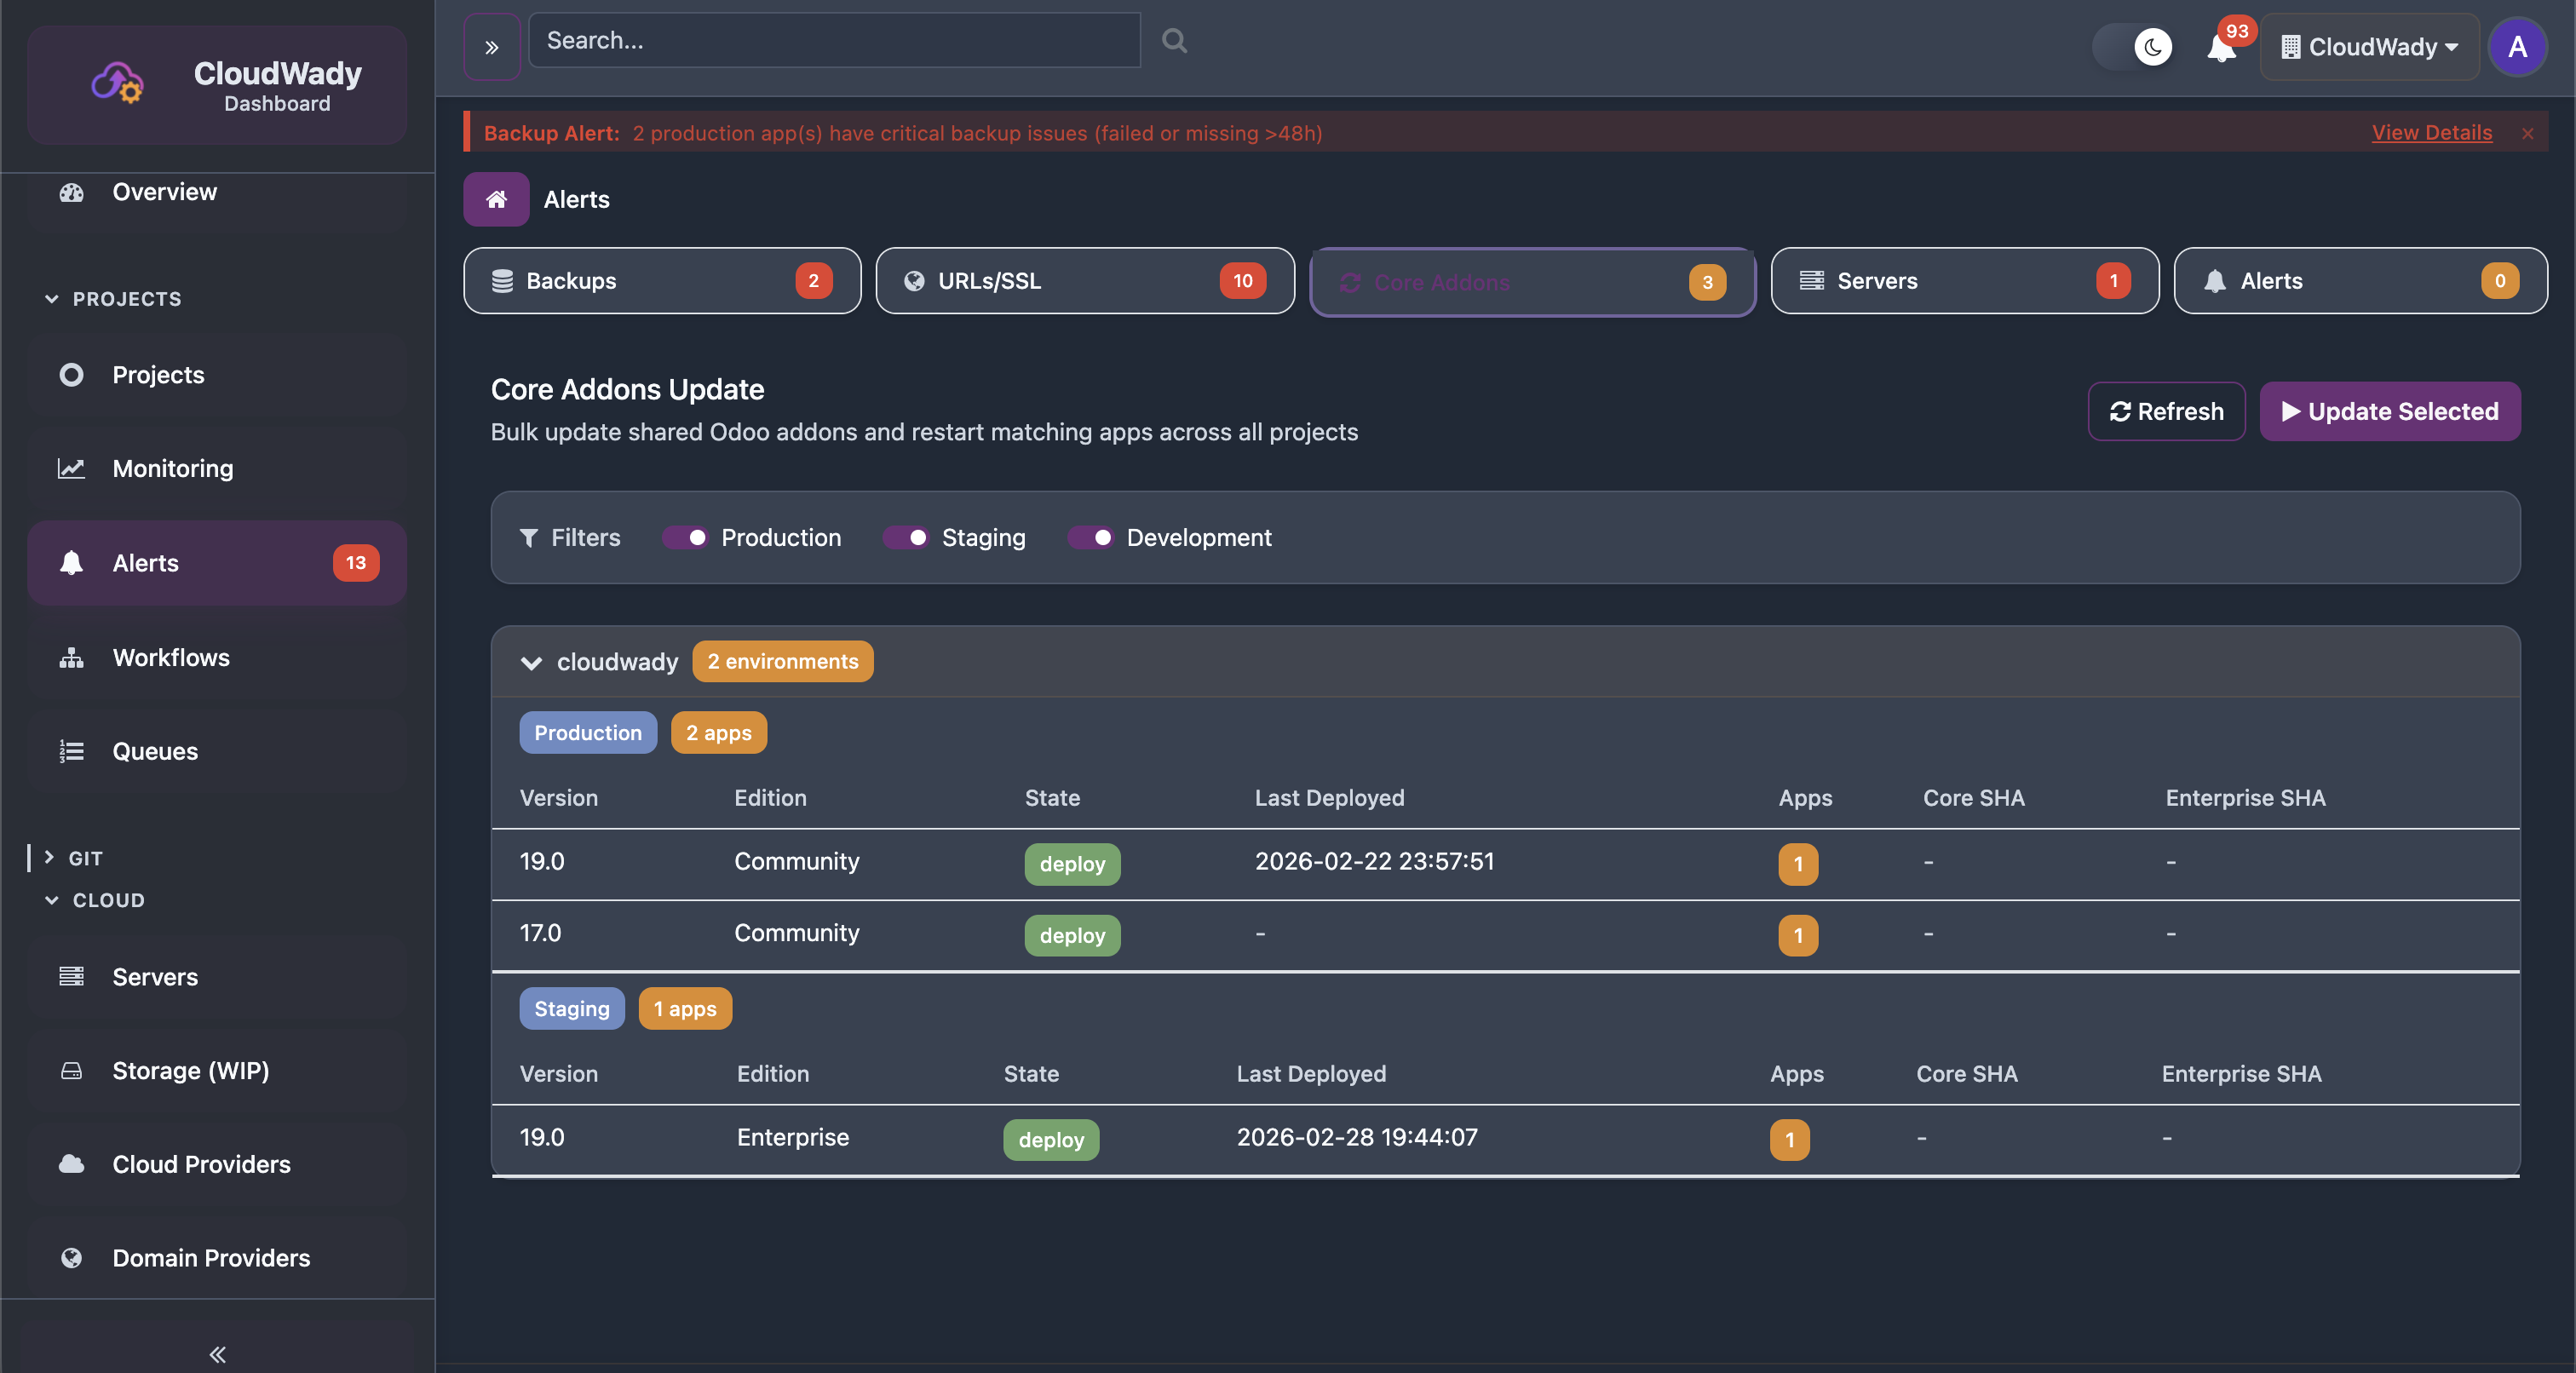
Applications are grouped by project environment (collapsible rows). Each group shows:
- Version: Odoo version (19.0, 18.0, 17.0, etc.).
- Edition: Community or Enterprise.
- State: Ready or needs update.
- Last Deployed: When the core addons were last updated.
- Apps: Number of affected applications.
- Core SHA / Enterprise SHA: Current commit hashes.
- Queue progress bar: Shows if update is in progress with completion count.
Available Actions
| Action | Description | Access Level |
|---|---|---|
| Update Selected | Update core addons for selected environments (disabled if none deployed) | Maintainer |
| Environment filters | Toggle switches for Production, Staging, Development | All |
| Refresh | Reload core addons status | All |
| Expand/Collapse project | Click project header to expand or collapse environment list | All |
Server Cleanup
The Server Cleanup tab monitors whether servers have run their periodic cleanup jobs (removing old logs, Docker images, temporary files).
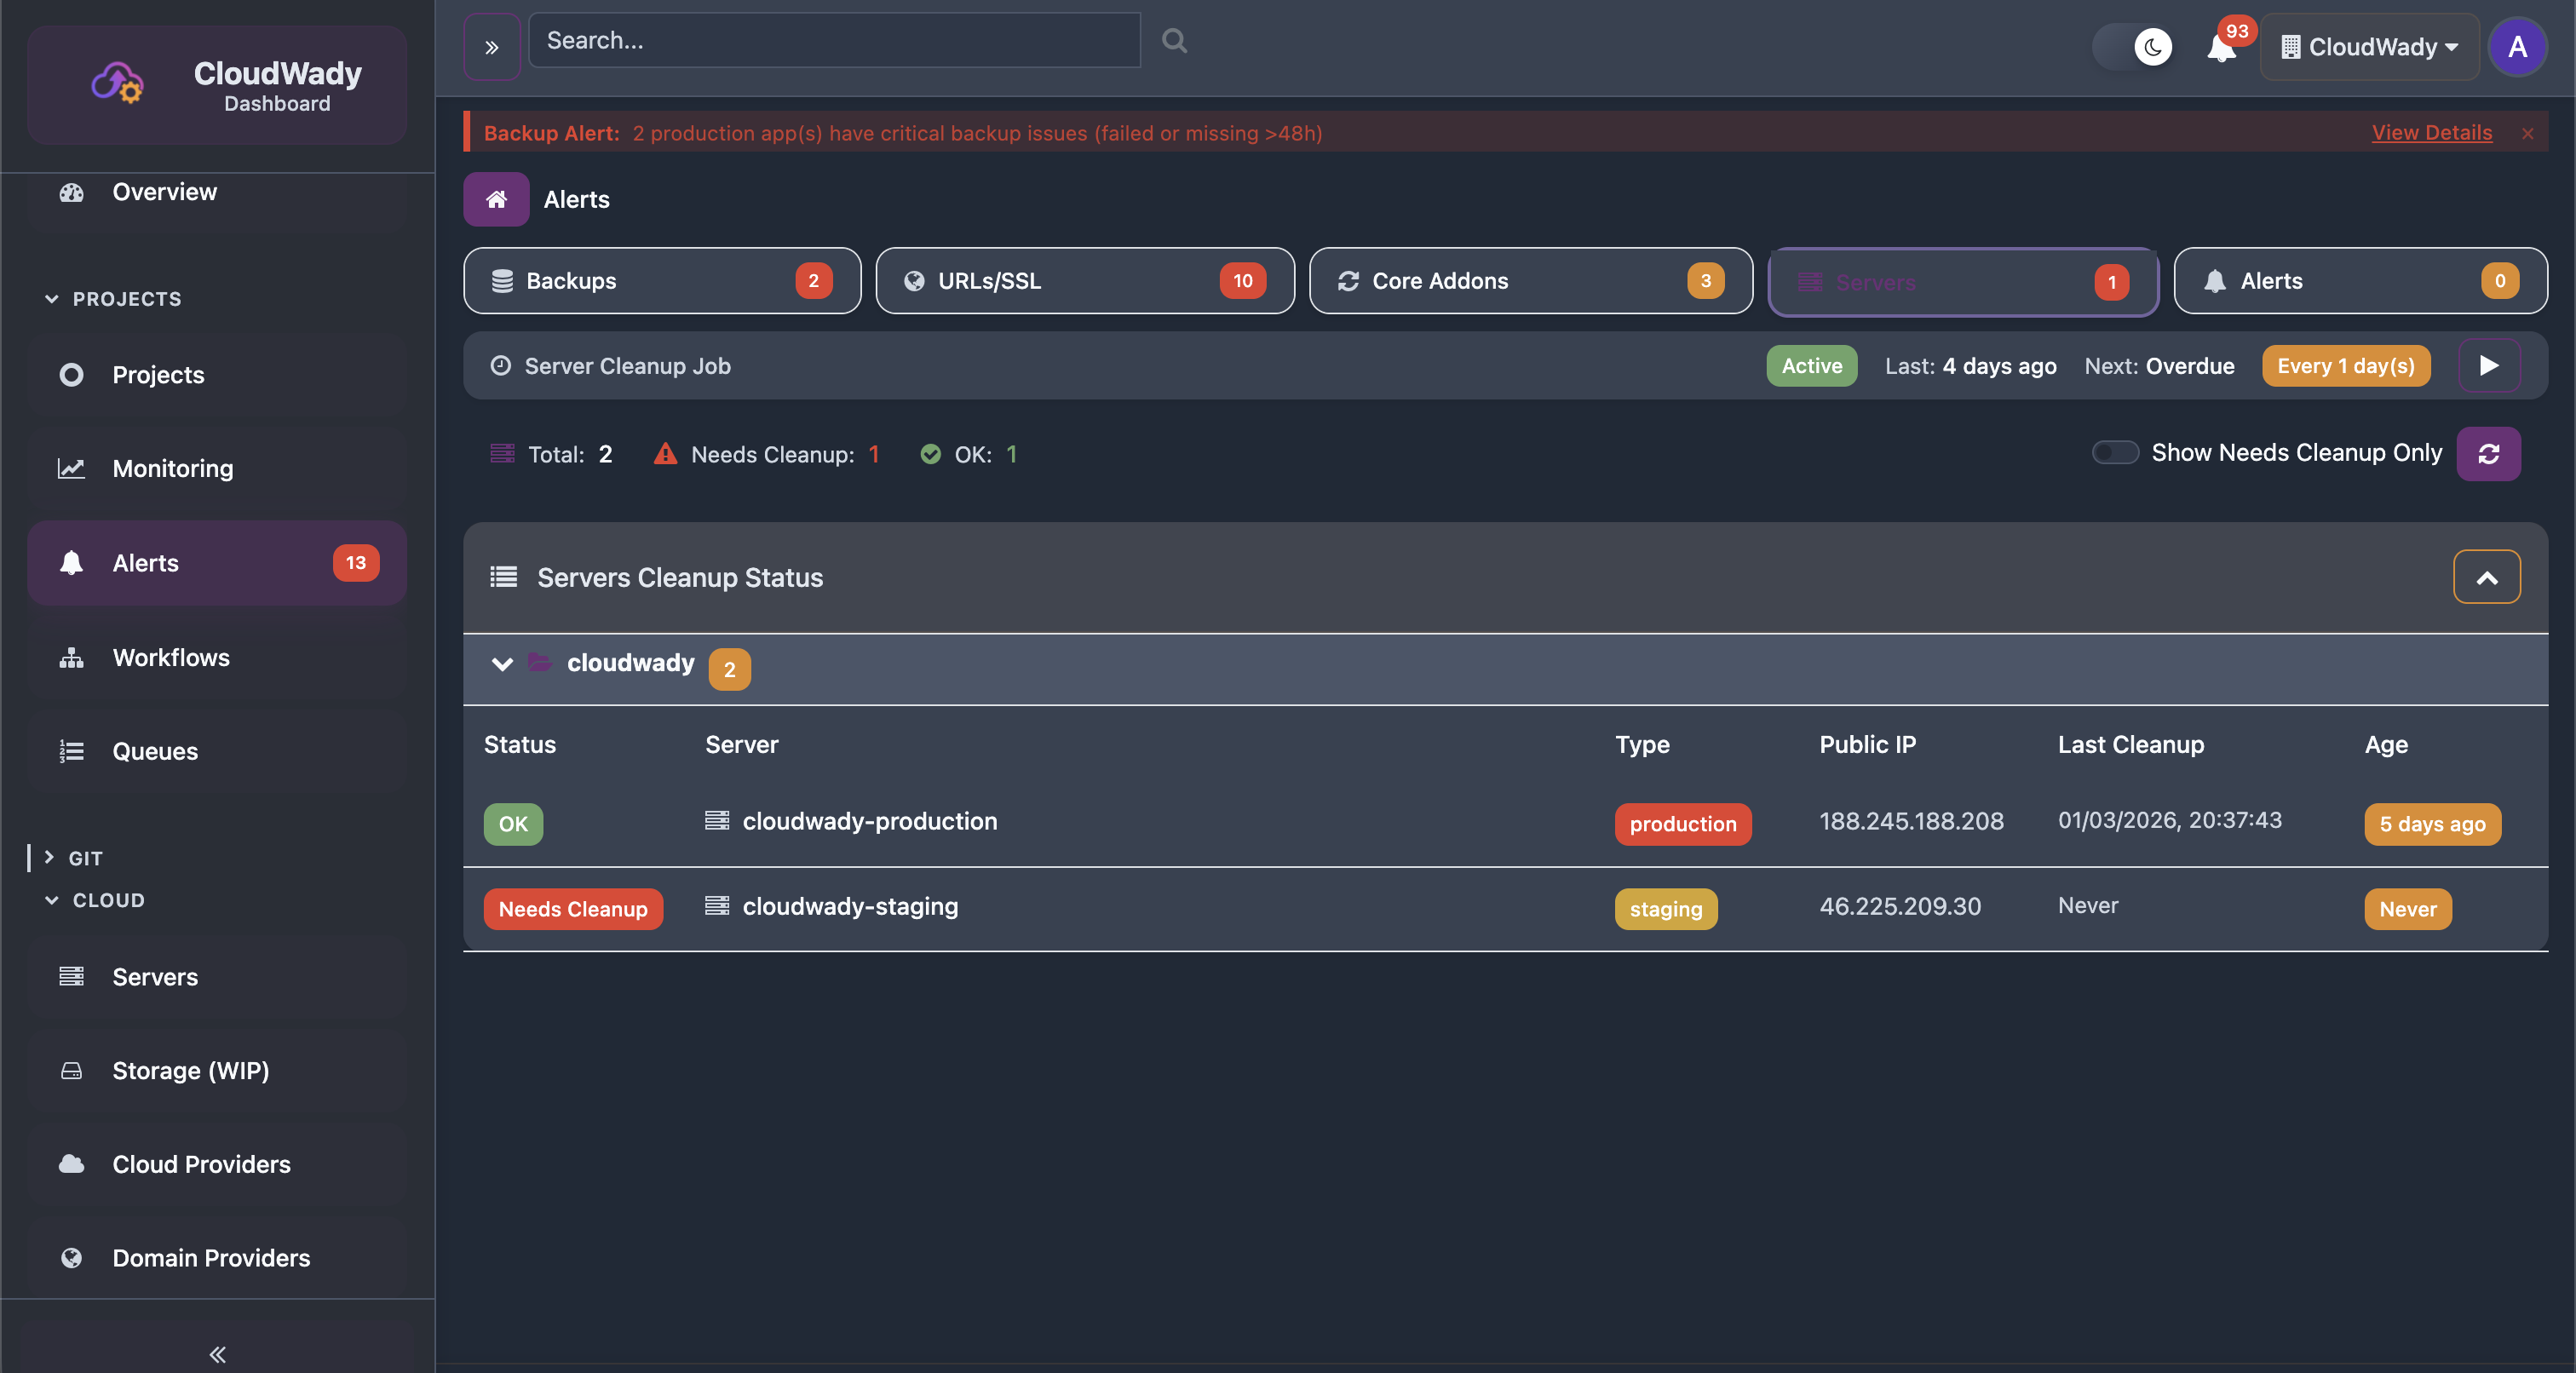
The cleanup table shows servers grouped by category, each with:
- Status: Green (clean) or red (Needs Cleanup).
- Server: Server name (clickable to navigate to server detail).
- Type: Server role (production, staging).
- Public IP: Server address.
- Last Cleanup: When the last cleanup job ran (or "Never").
- Age: Time since last cleanup with color-coded badge.
Available Actions
| Action | Description | Access Level |
|---|---|---|
| Show Needs Cleanup Only | Toggle to show only servers requiring cleanup | All |
| Collapse All / Expand All | Toggle all server groups collapsed or expanded | All |
| Refresh | Reload cleanup status | All |
| Click server row | Navigate to server detail screen | Viewer+ |
Alert Integrations
Configure how and where you receive alert notifications. CloudWady supports multiple notification channels and customizable alert rules.
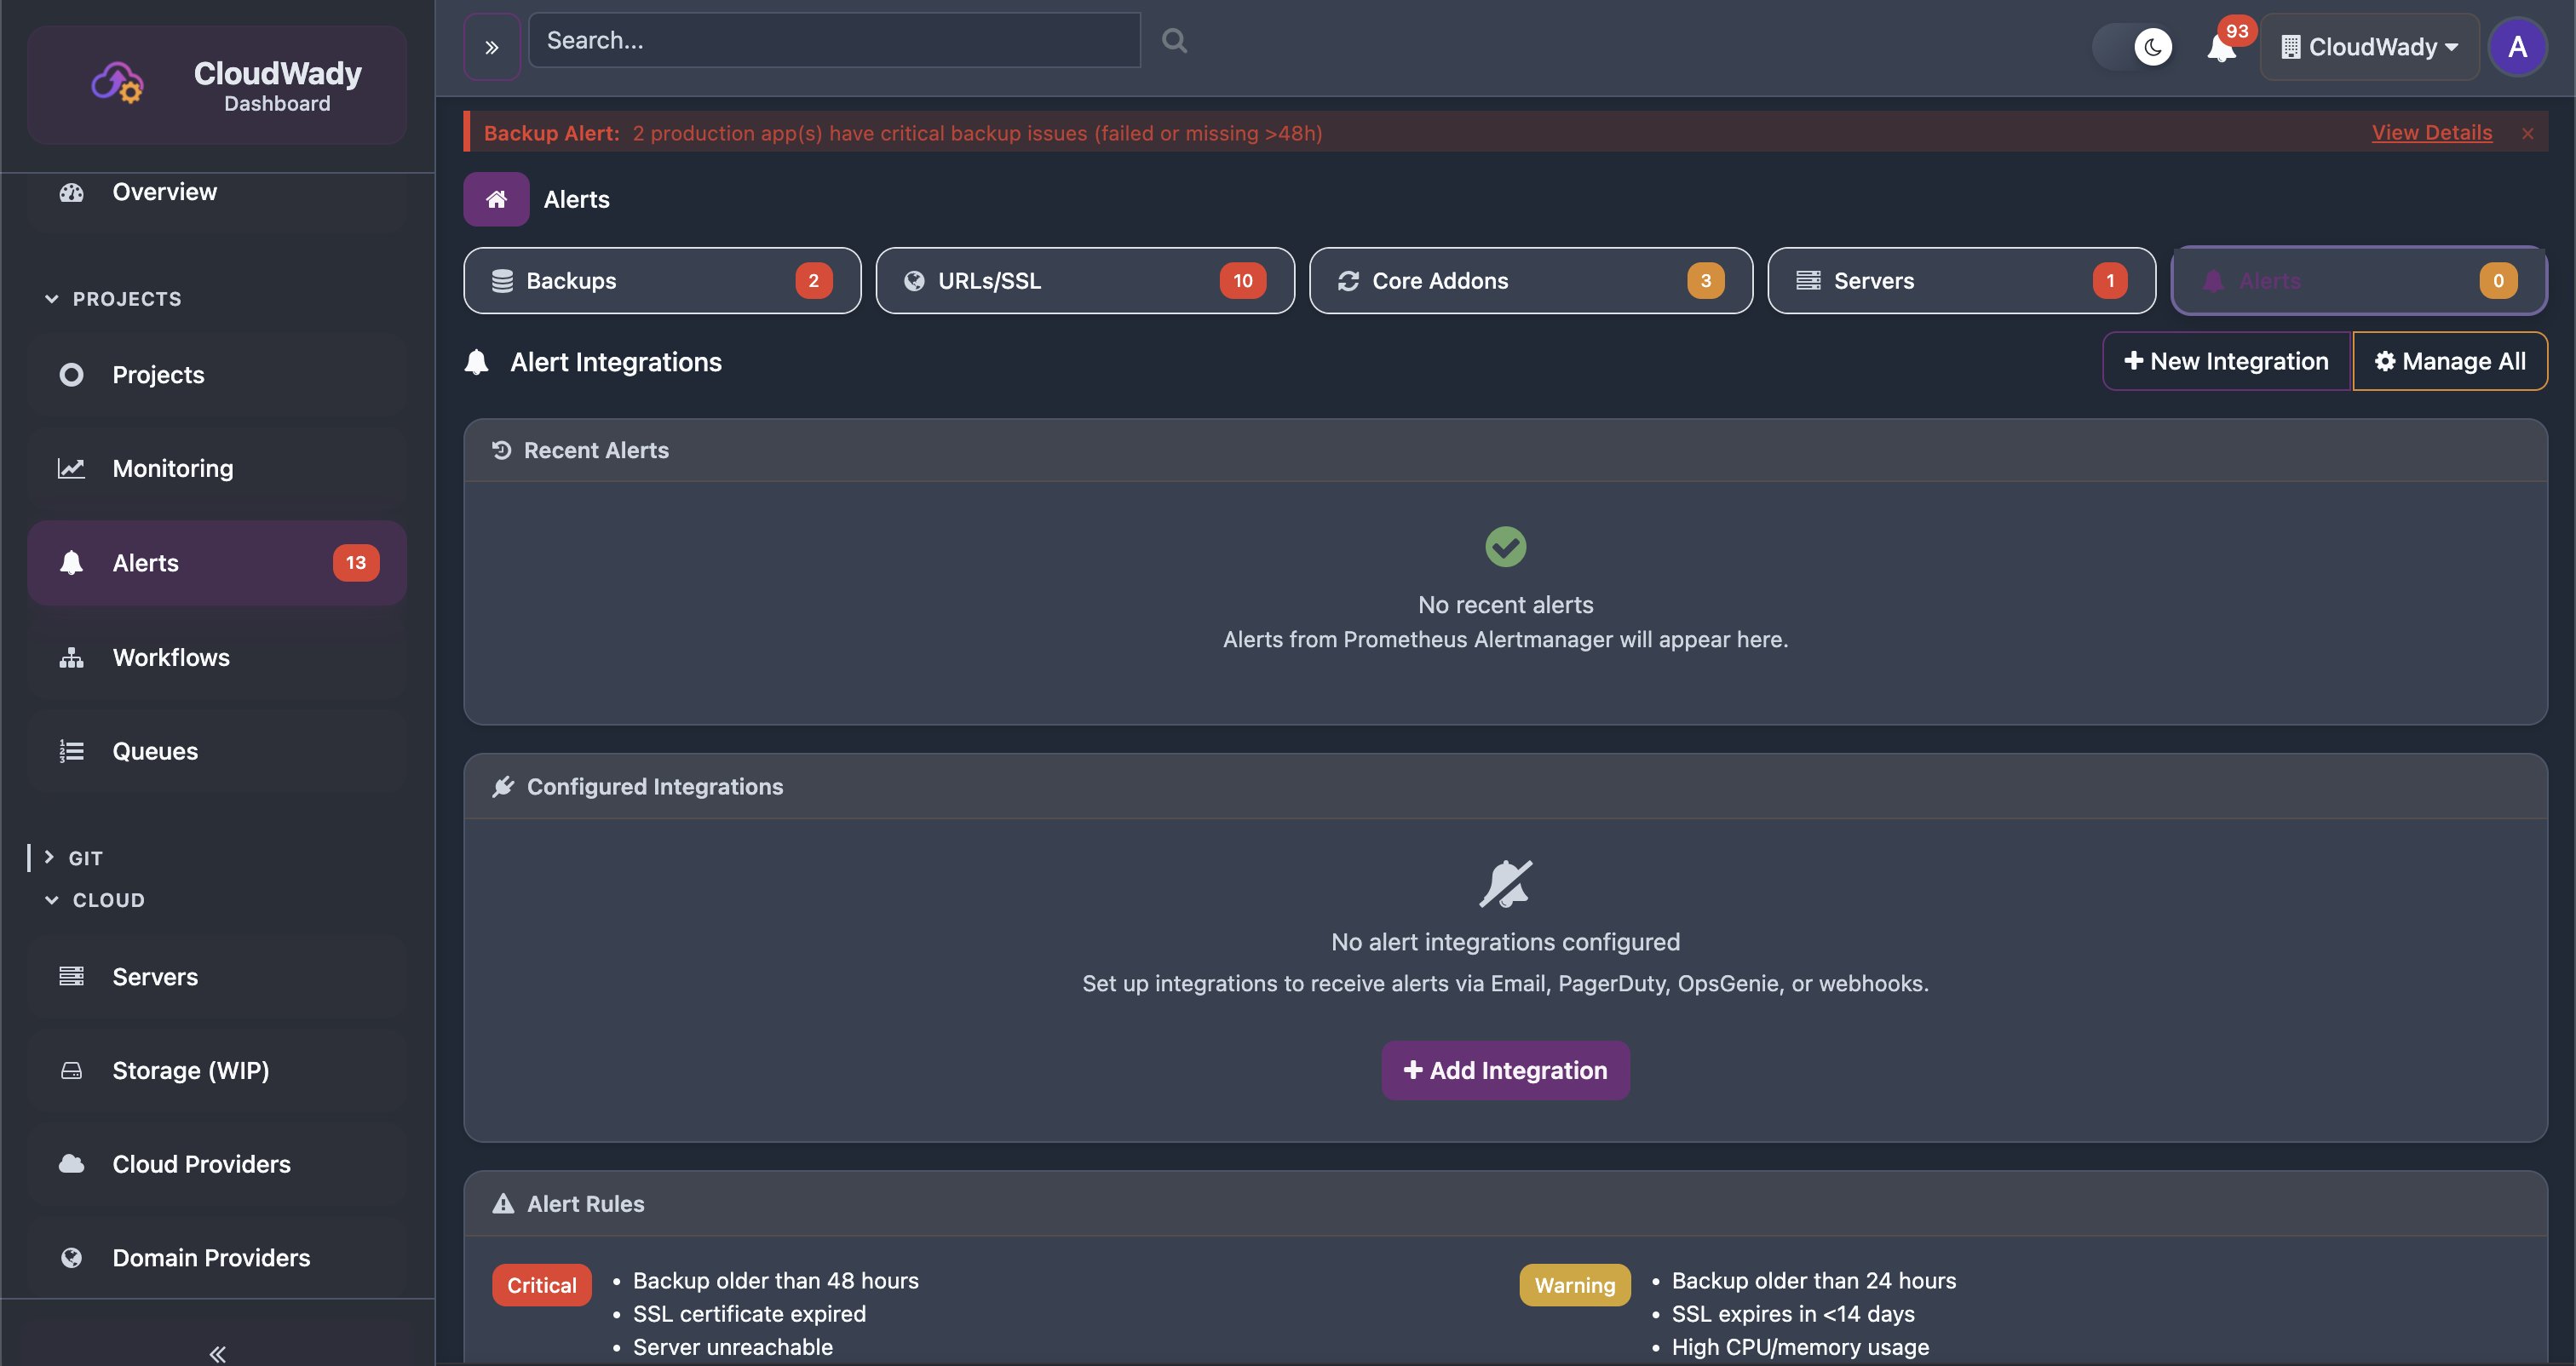
Recent Alerts
A table shows recent alert events with: Status, Alert name, Severity, Time, and Delivery status. A badge shows the count of currently firing alerts.
Integration Types
Receive alerts via Email, PagerDuty, OpsGenie, or custom webhooks. Alerts from Prometheus Alertmanager are also supported.
Available Actions
| Action | Description | Access Level |
|---|---|---|
| + New Integration | Create a new alert notification channel | Maintainer |
| Manage All | View and manage all configured integrations (cog icon) | Maintainer |
| Test (per integration) | Send a test alert to verify the integration (paper-plane icon) | Maintainer |
| Toggle Active (per integration) | Enable or disable the integration (play/pause icon) | Maintainer |
| Edit (per integration) | Edit integration configuration (pencil icon) | Maintainer |
| Delete (per integration) | Delete the integration (trash icon) | Admin |
| + Add Integration | Create first integration (shown only in empty state) | Maintainer |
Queue & Job Monitoring
All deployment operations run as background jobs in a queue. CloudWady provides full visibility into job processing at both platform and project level.
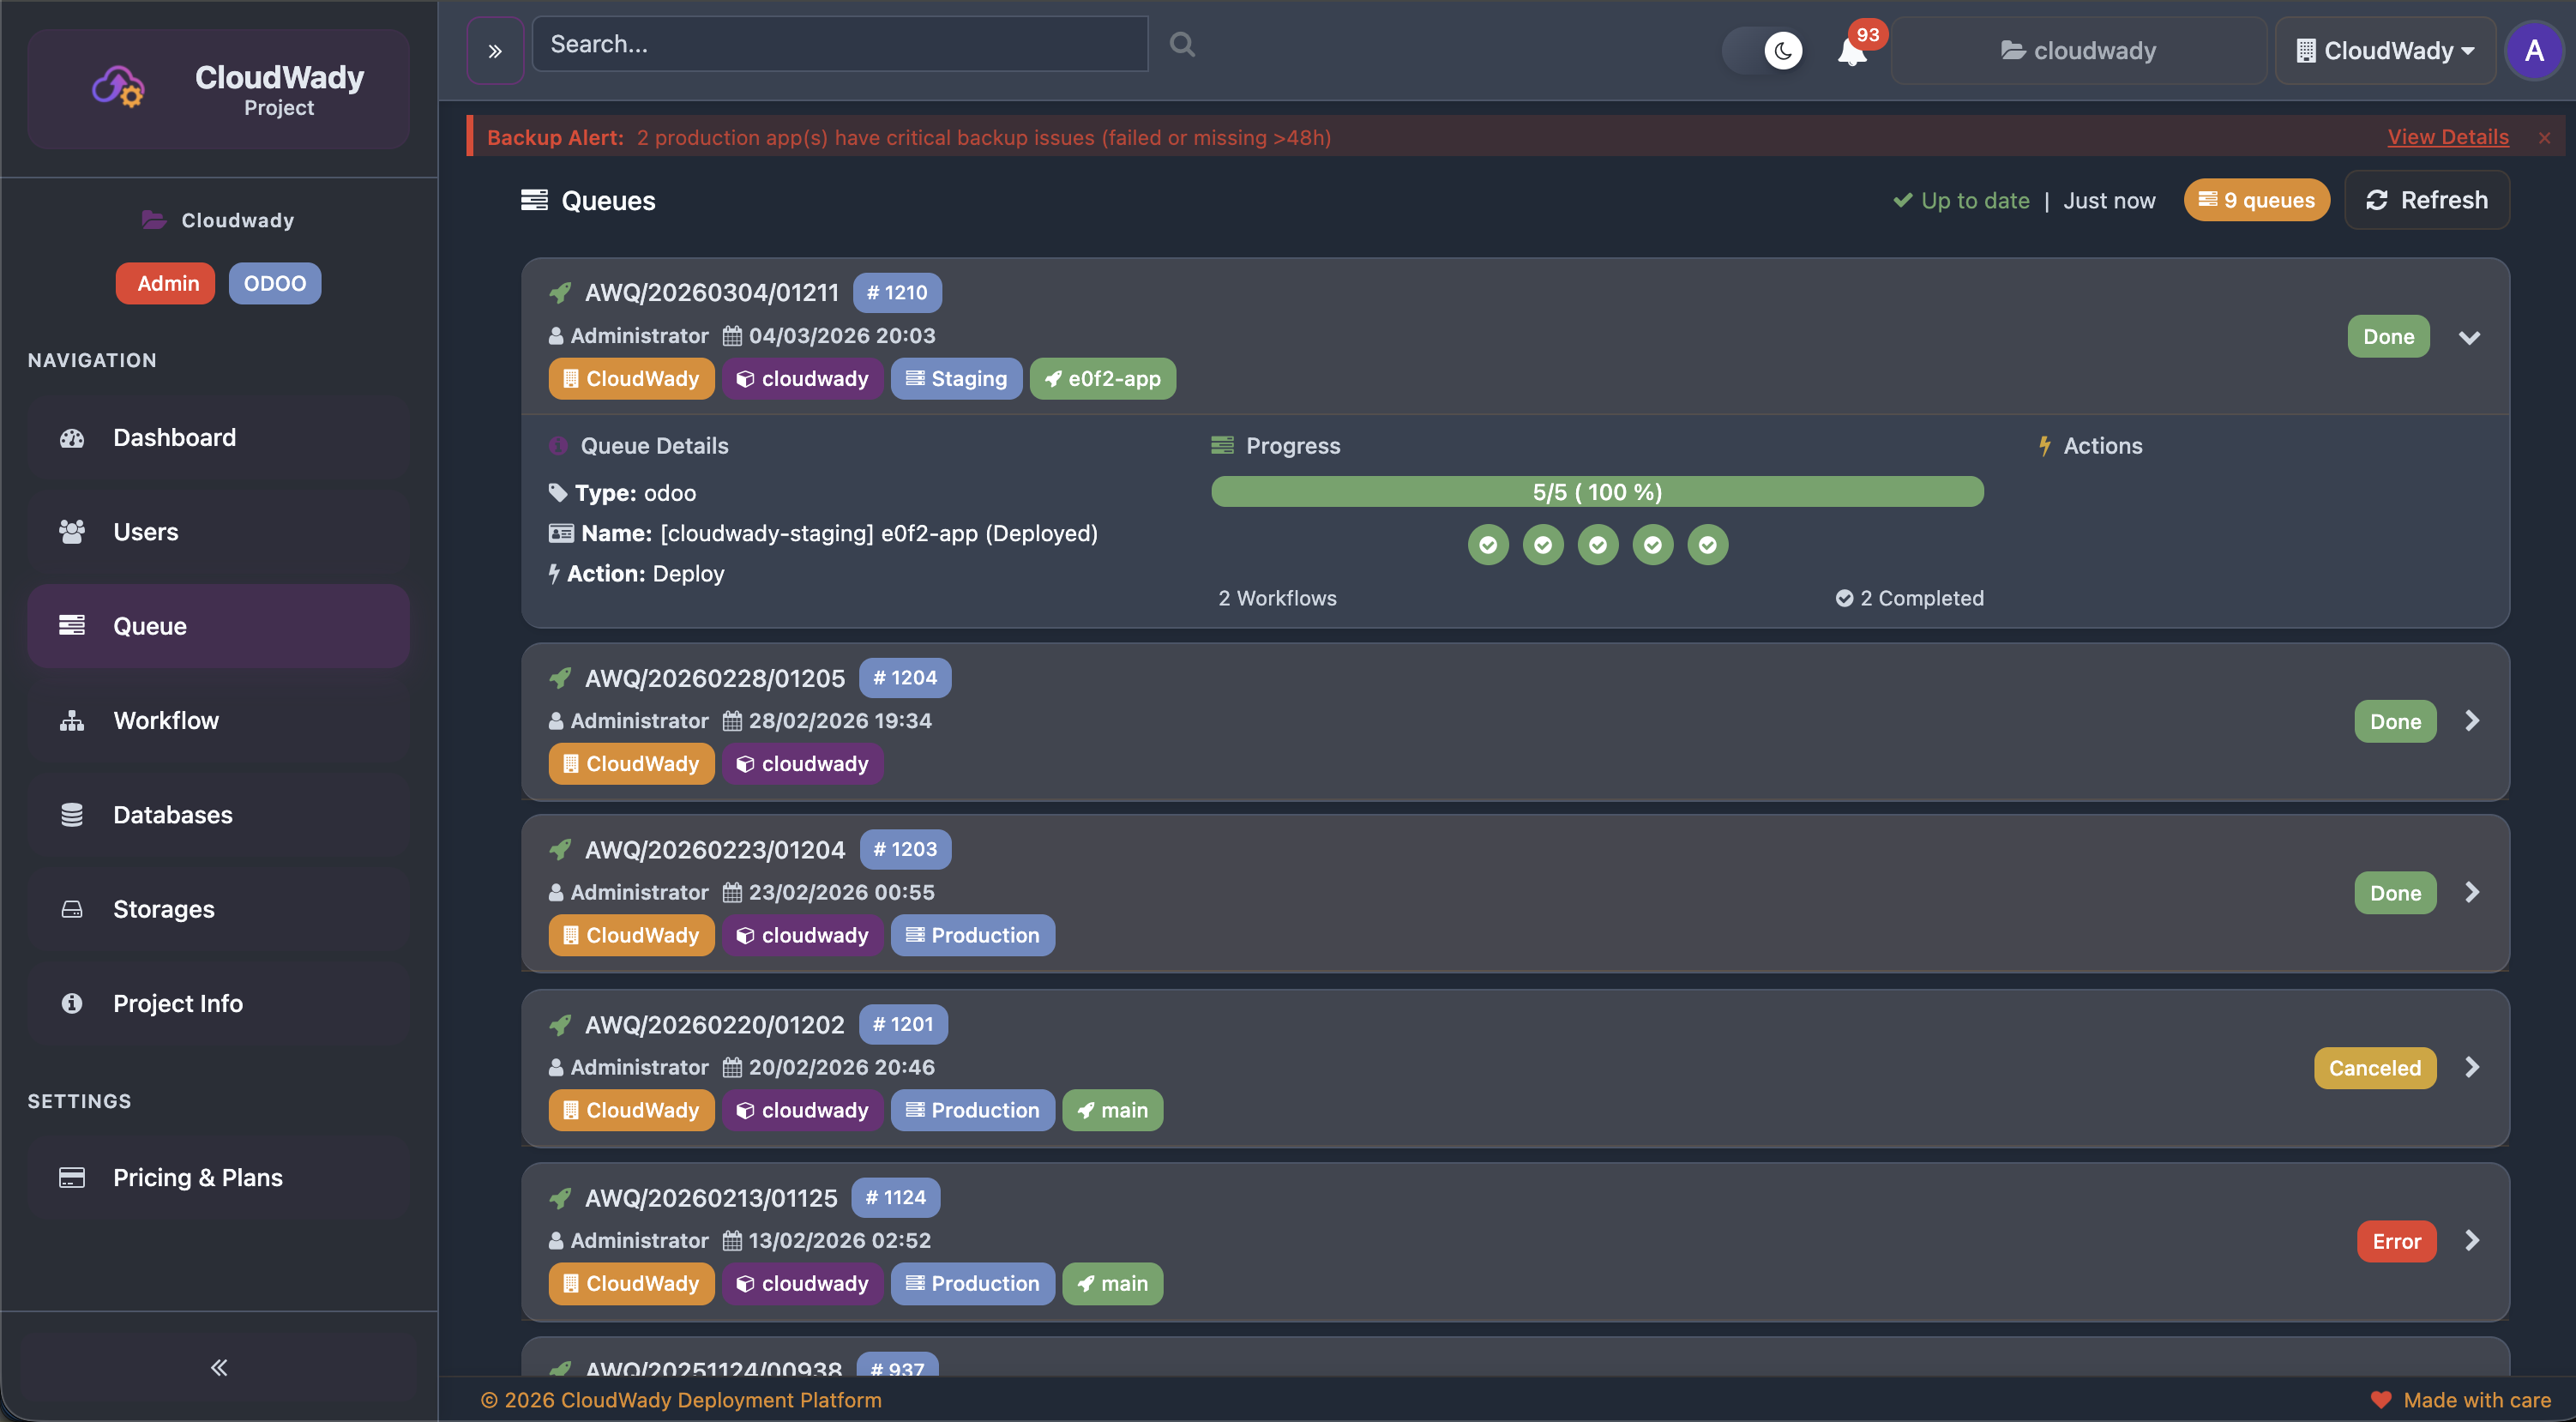
Each queue entry shows:
- Queue ID: Unique identifier with sequence badge.
- User: Who initiated the queue entry (e.g., Administrator).
- Timestamp: When the job was created.
- Project & Environment tags: Which project and environment the job targets.
- Progress bar: Visual workflow completion progress.
- Workflow count: Number of workflows and completed count.
- Status badges: Green for done, red/orange for errors.
Job States
| State | Description |
|---|---|
| Pending | Job is queued, waiting for a worker to pick it up. |
| Running | Job is actively executing. Logs stream in real-time. |
| Success | Job completed successfully. |
| Failed | Job failed. Check logs for error details. |
| Cancelled | Job was manually cancelled before completion. |
Available Actions
| Action | Description | Access Level |
|---|---|---|
| Time filter | Filter queues by time range | All |
| Refresh | Reload queue data | All |
| Expand | View workflow details within a queue entry | All |
Access Levels & Permissions
CloudWady uses a granular permission system with six access levels, applied per company/organization.
| Level | Scope | Key Permissions |
|---|---|---|
| Admin | Global | Full platform access. User management, infrastructure, all settings, project creation and deletion. |
| Maintainer | Global | Infrastructure management, server provisioning, workflow configuration, cloud providers, all deployments. |
| Developer Plus | Project | Deploy to all environments including production. Manage backups, restorations, and app configuration. |
| Developer | Project | Deploy to development and staging environments. Cannot deploy to production. |
| Viewer | Project | Read-only dashboard access. Can view project status but cannot make changes. |
| None | - | No access to the deployment platform. |
How Permissions Work
- Permissions are assigned per company/organization via the access management system.
- Higher access levels inherit all permissions from lower levels.
- The sidebar dynamically shows or hides sections based on your access level.
- Action buttons (Deploy, Delete, etc.) are visible only if you have the required permission.
- Environment-specific actions (e.g., deploying to production) require environment-type-specific permissions.
Troubleshooting
Common Issues
| Issue | Solution |
|---|---|
| Permission Denied | Check your access level. Production deployments require Developer Plus or higher. Contact your project admin to adjust permissions. |
| Deployment Failed | Open the Workflow menu and check the Ansible output logs. Common causes: Git connectivity, insufficient server resources, or configuration errors. |
| App Not Starting | Check the Logger in the app sidebar for application errors. Verify Odoo configuration and database connection. |
| Backup Failures | Verify storage box connection in Storages. Check available space and SSH key configuration. See Backup Alerts for details. |
| SSL Certificate Issues | Check the SSL & URL Alerts tab. Ensure DNS is configured and pointing to the correct server IP. Use the Check and Renew actions. |
| Login Problems | Verify your account is active. If using GitHub OAuth, ensure the GitHub App is connected. Contact admin for password resets. |
| Server Unreachable | Check the Server Cleanup alerts and server metrics. Verify the server is running in your cloud provider dashboard. |
Getting Help
- Check the Queue and Workflow logs for detailed error output.
- Use the Logger in the app sidebar for real-time application logs.
- Review Alerts for proactive issue detection.
- Use Monitoring dashboards for server-level diagnostics.
- Contact CloudWady support at support@cloudwady.com.